

















































































Verified Platforms
Quick Links
Where to Stay Secure
Thank you! Your submission has been received!
Oops! Something went wrong while submitting the form.

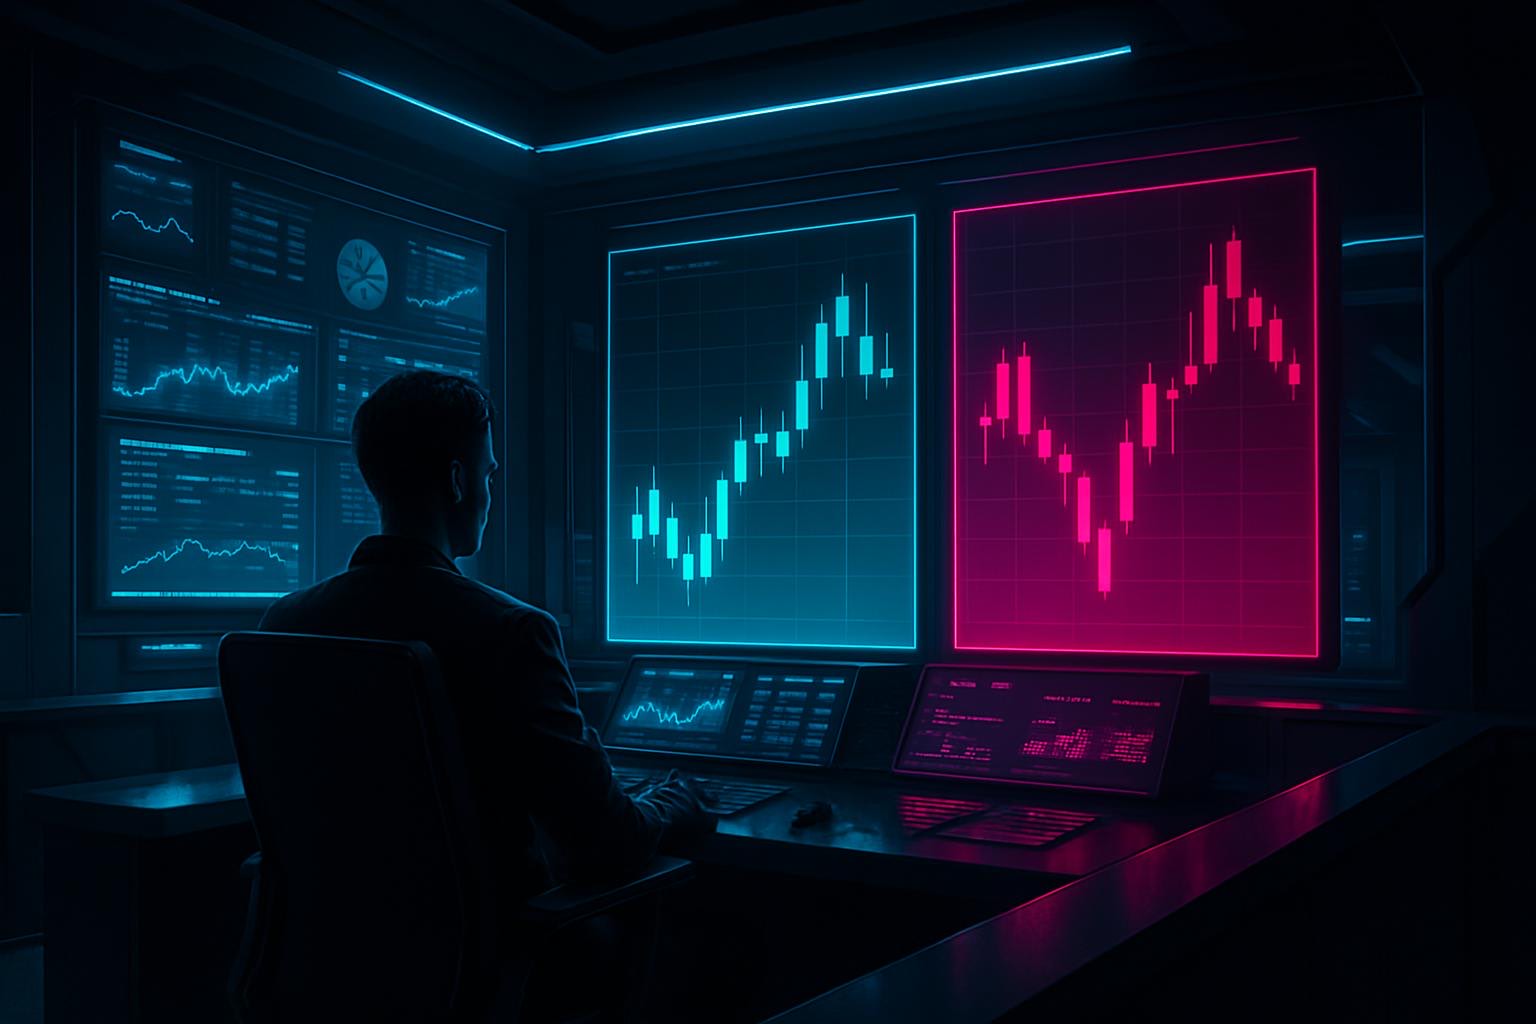
Your worst loss was not a surprise. It was a rerun, and you have the tape.
You can probably still describe it. The size was bigger than you would defend now, and the entry came faster than the plan allowed. By the time you closed it, the number had stopped being a position and started being a fact about your month.
The way you review your trades decides whether that ever gets caught. Reading down a list of closed positions in order is not the same as pulling the two extremes up together and asking what they share. Do the second and the pair stops looking like opposites. Same hour, same setup family, same jump in size, one paid and one bled.
Trade Forensics is the panel in Pattern Intelligence where those two get pulled up side by side. It does not score you. It shows you the bodies.
This walkthrough follows Eunha, who lives between structure and emotion at Kodex and pulls the truth out of you through questions. She reads what an average never will: your single best and your single worst trade, and the hours when your decisions hold. Then the hold time on your winners against your losers, and how each entry was taken before the market had done anything at all.
Eunha starts at the extremes, because the middle of your distribution has never decided anything.
Take sixty closed trades and average them. What comes back is a description of the middle: a win rate, a mean R, a number that behaves like a grade. Pull the three worst trades out of that set and the equity curve changes shape. Pull the three best out and it changes again, in the other direction. Everything between those two handfuls is noise you have already survived.
That is the trouble with grading yourself on an average. It is not built to be accurate, but to be stable, which means it absorbs exactly the positions that moved your balance. Pattern Intelligence reads the ends instead.
"An average tells you what usually happens," Eunha says. "You did not blow up on what usually happens."
So start with two. Not a sample and not a month: the single best and the single worst, opened in the same window on the same screen.
The instinct is to hunt for the difference, because the outcomes were opposite and the difference is where you expect the lesson to sit. Run it the other way. Ask what the two have in common and the list is usually longer than you want it to be. Same time of day. Same setup, or a close relative of it. Same jump in size above your normal, the same twenty minutes of holding through discomfort, one of which paid and one of which did not.
That shared column is your method. Not the intended one written at the top of the plan, but the one your hands actually run.
A winner is easy to mythologise. You remember the read, the patience, the exit, and the whole thing gets filed under skill. A loss files a colder report, which is why reviewing losers before winners is the standard advice, and it is good advice as far as it goes. It also leaves you studying one half of a habit. The size that ruined the bad trade is the size that made the good one. Look only at the wreck and you will treat a working part as a defect.
Eunha never asks which of the two was better. She asks which decision appears in both, and whether you would make it again on purpose.
The difference is not the data. Your record already holds the timestamps, the sizes, the durations and the exits, whether or not anything is ever asked of them. The difference is the question.
| What you are reading | The scoreboard version | The forensic version |
|---|---|---|
| Outcomes | Win rate across every trade | The single best and the single worst, side by side |
| Size | Average position size | The size you used on the two trades that decided the month |
| Timing | How many trades you took | Which hours you took them in, and how those hours paid |
| Exits | Average hold time | Hold time on winners set against hold time on losers |
| Entries | An entry quality score | Whether the entries you chased are the ones that bled |
Read down the middle column and every row is one number about all of your trades at once. Read down the right and every row points at specific positions you could open and look at tonight. The middle column improves by taking more trades. The right column can only be answered by reading the ones you already took.
Because you are not the same instrument at 09:00 and at 23:40, and the market does not adjust for it.
The time-of-day view lays your results out by the hour the position was opened. What surfaces is rarely a smooth curve. It tends to be one or two windows carrying your good decisions, and one quietly carrying the damage. That one is usually the hour after work, the hour after a loss, or the late session taken because you were still awake rather than because the setup arrived.
There is decent evidence that the hour itself works on the decision. Sievertsen, Gino and Piovesan measured Danish school test results across four school years. Performance fell by 0.9% of a standard deviation for every hour later in the day, while a twenty to thirty minute break lifted it by 1.7%. Children sitting a test are not you sizing a position. The resource being drained is the same one, and your position costs more than the test does.
This is the finding you can act on before the next session, because it is not a virtue, but a setting. You do not have to become more disciplined at 23:40. You can stop trading at 23:40.
"Discipline is expensive," Eunha says. "Scheduling is free."
The exits carry a second asymmetry, and it is the easiest one to read because the direction alone is the diagnosis.
Set the average hold time of your winners beside the average hold time of your losers. If the losers run longer, gains are being cut early while losses are given room. Behavioural finance files that under the disposition effect: selling winners and holding losers, documented across brokerage records for decades. What sits underneath is not greed in the way the word normally gets used, but discomfort management. Closing a winner ends an uncomfortable state, and closing a loser converts a floating number into something you have to own.
What the forensic view adds is the pairing. A hold-time gap on its own is a statistic. A hold-time gap sitting beside your best and worst trade tells you whether that gap is what produced them, and that is a different question with a different repair.
Entry quality asks something narrower than it sounds: did the market give you the entry, or did you go and take it?
Waiting for a level to come to you and chasing a candle that already left both end in an open position. They do not end in the same position. The chased entry starts closer to your stop, which shortens the distance the trade has to breathe before it begins arguing with you. A trade that argues early is the one you are most likely to manage badly.
Run the entry read across your winners and your losers separately and one of two things shows up. Either both sets look alike, in which case the leak is in management rather than selection, or the losers are visibly more rushed, in which case the analysis was fine and the patience was not. Those two findings send you to opposite ends of your process, and the usual crypto trading mistakes cluster around the second one.
There is a reason your recollection of a trading month is not admissible.
An experience does not get replayed when you remember it. It gets rebuilt out of its most intense moment and its ending, which is the peak-end rule. A month that finished green gets remembered as a green month, whatever happened in the middle of it. Ask yourself how June went and you will answer from two data points, both selected by feeling.
The record has no such filter. It holds the entries you would rather not revisit at the same resolution as the ones you describe to friends, in order, with timestamps that cannot be negotiated with. The behavioural read of a body of simulated trades lands in the same place: the story is about the market and the record is about you.
Trade Forensics is one view inside Pattern Intelligence, which reads ten behavioural dimensions out of your simulated history on Kodex. It does not grade your character or forecast your next position. It pulls up the specific trades your account was actually built from, which is a smaller and far more useful claim.
Eunha's version of the question is blunt. You reviewed the average and felt roughly fine, because an average is designed by arithmetic to feel roughly fine. Your balance was never moved by the average. It was moved by a handful of positions at the ends, and the trade that finally ends an account has almost always visited that account once before.
Name your worst trade out loud, then name your best one. If the two descriptions start to sound related, you have already found the thing worth reading. The Trading DNA read pulls that pattern out of your history in about two minutes with no signup and names the archetype it belongs to. Then go and build a record worth an autopsy: a $5,000 paper account in the simulator, where a loss is a specimen rather than a bill.