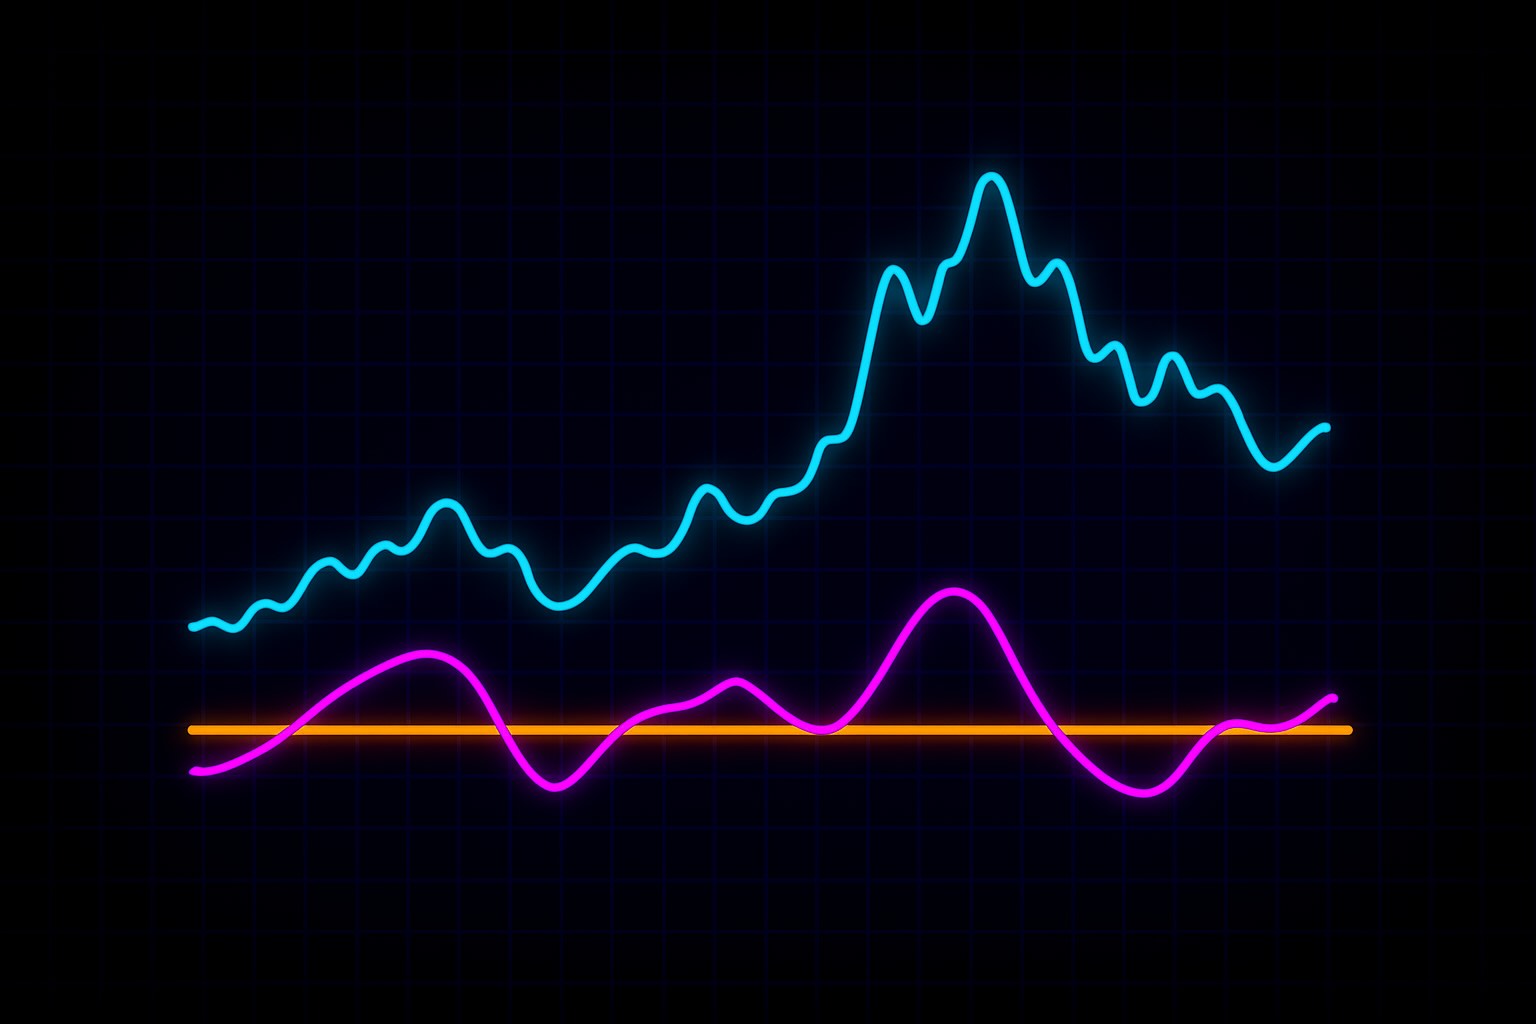
What Is the RSI Indicator
Is the move overbought or oversold? Learn how RSI tracks momentum in crypto trading and signals potential reversals when pressure builds at the extremes.
Explore The How
What Is the RSI Indicator
Trend Analysis & Momentum

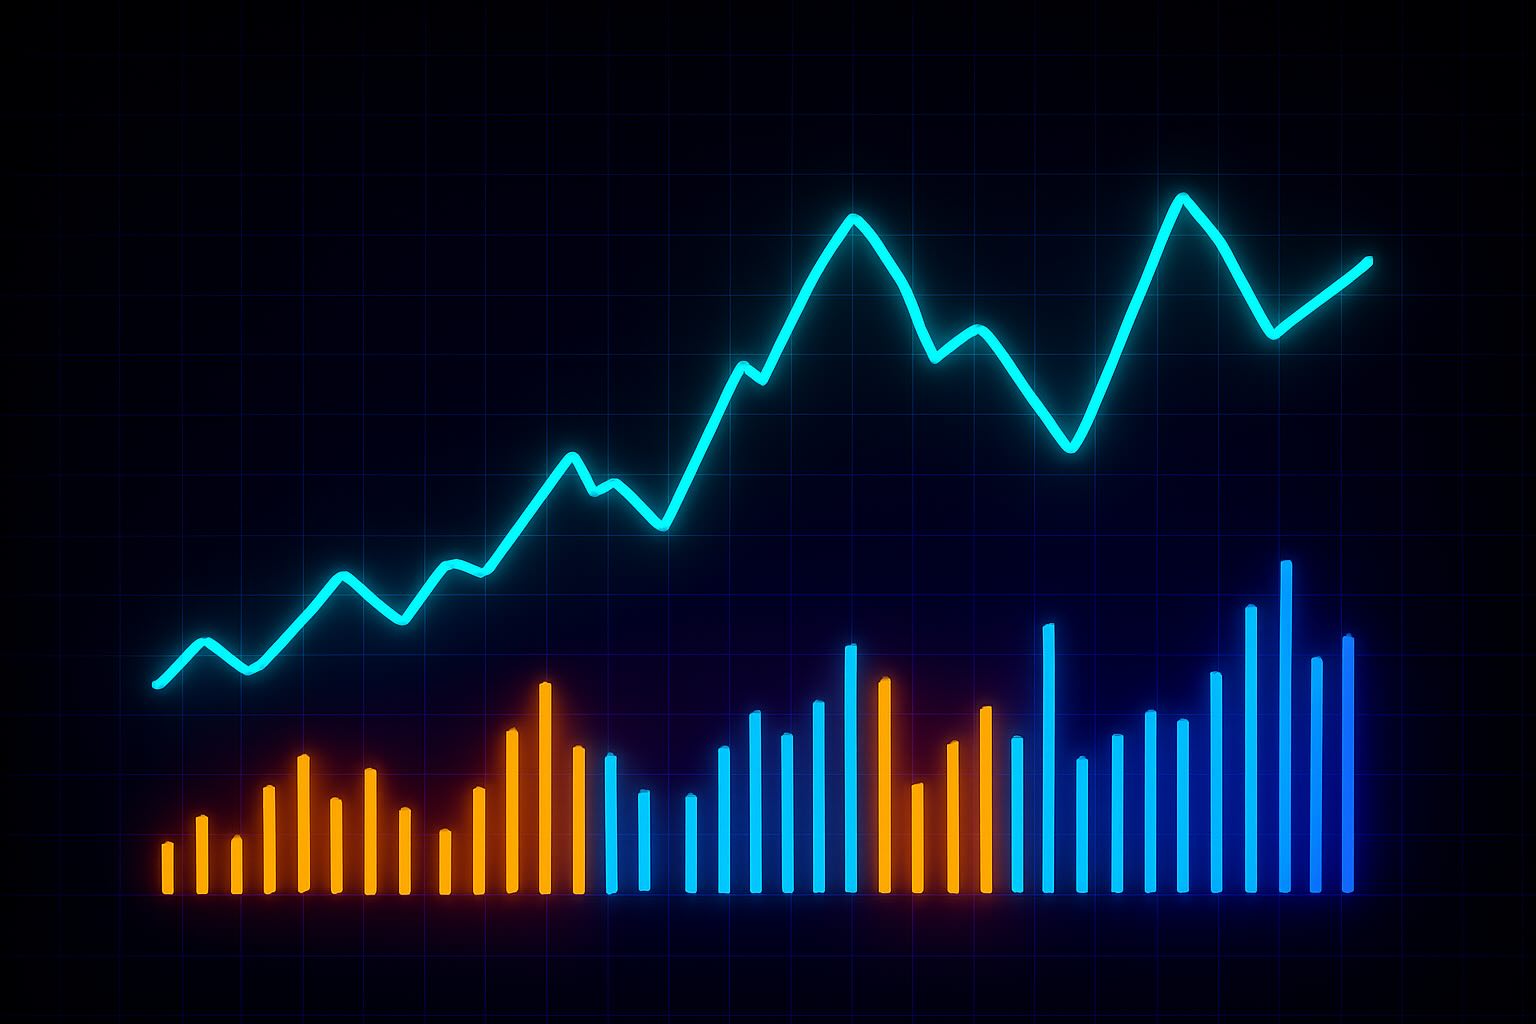
What Is the MACD Indicator
Catch momentum shifts early with the MACD indicator. Learn how signal crossovers and divergences reveal crypto trend reversals before price confirms.
Explore The How
What Is the MACD Indicator
Trend Analysis & Momentum
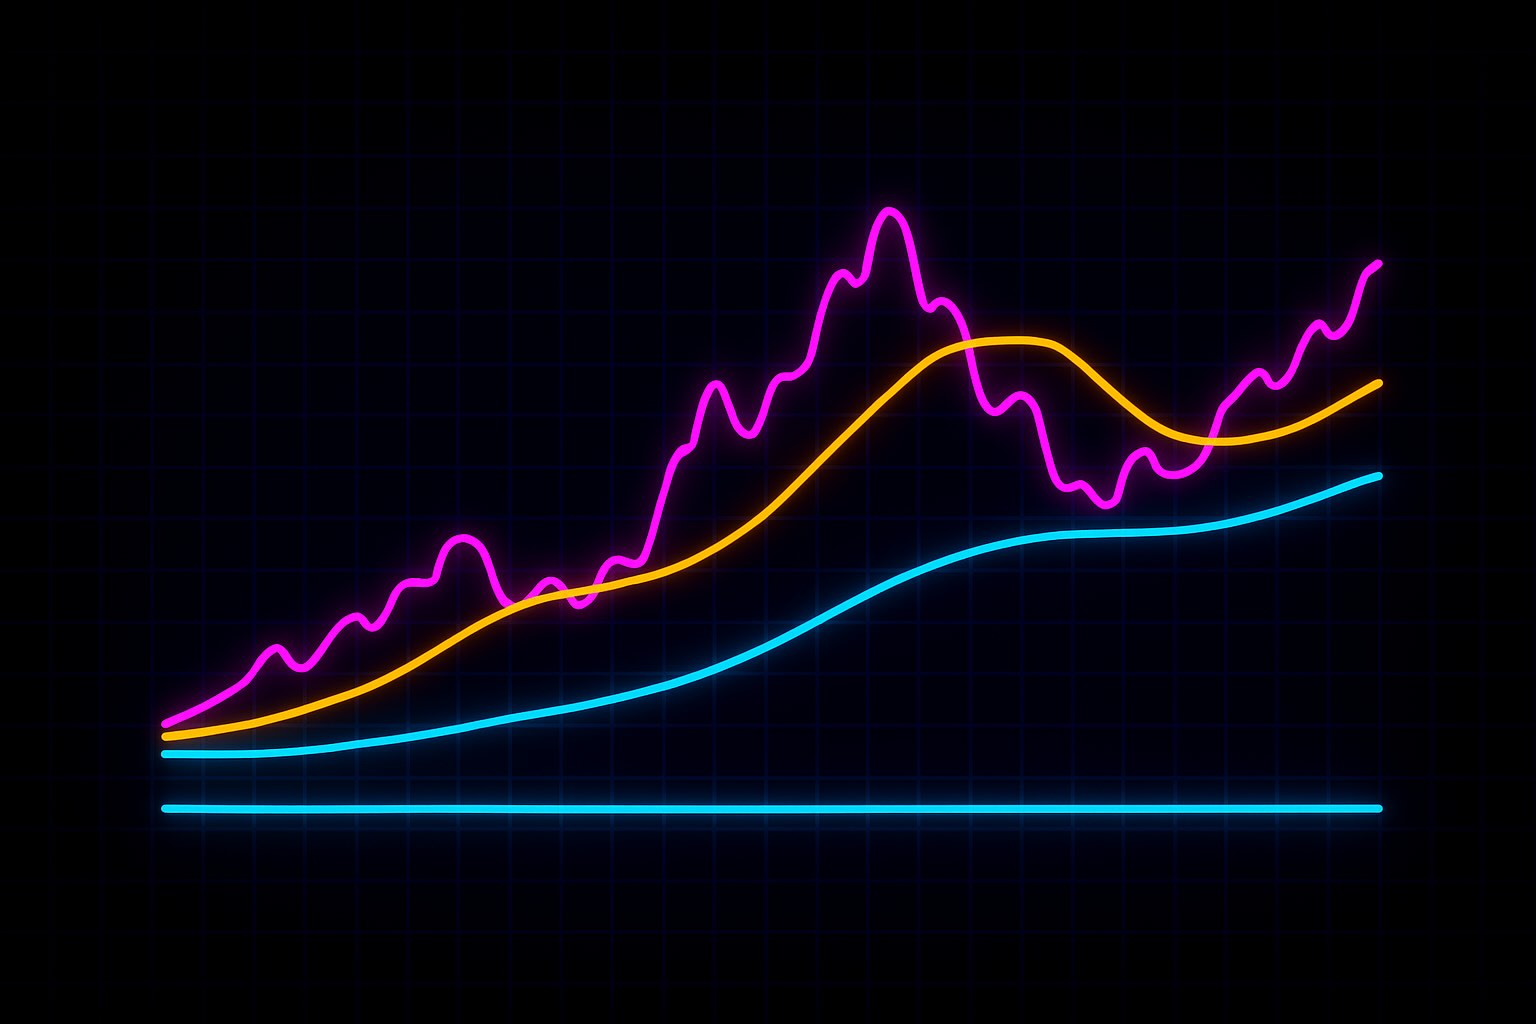
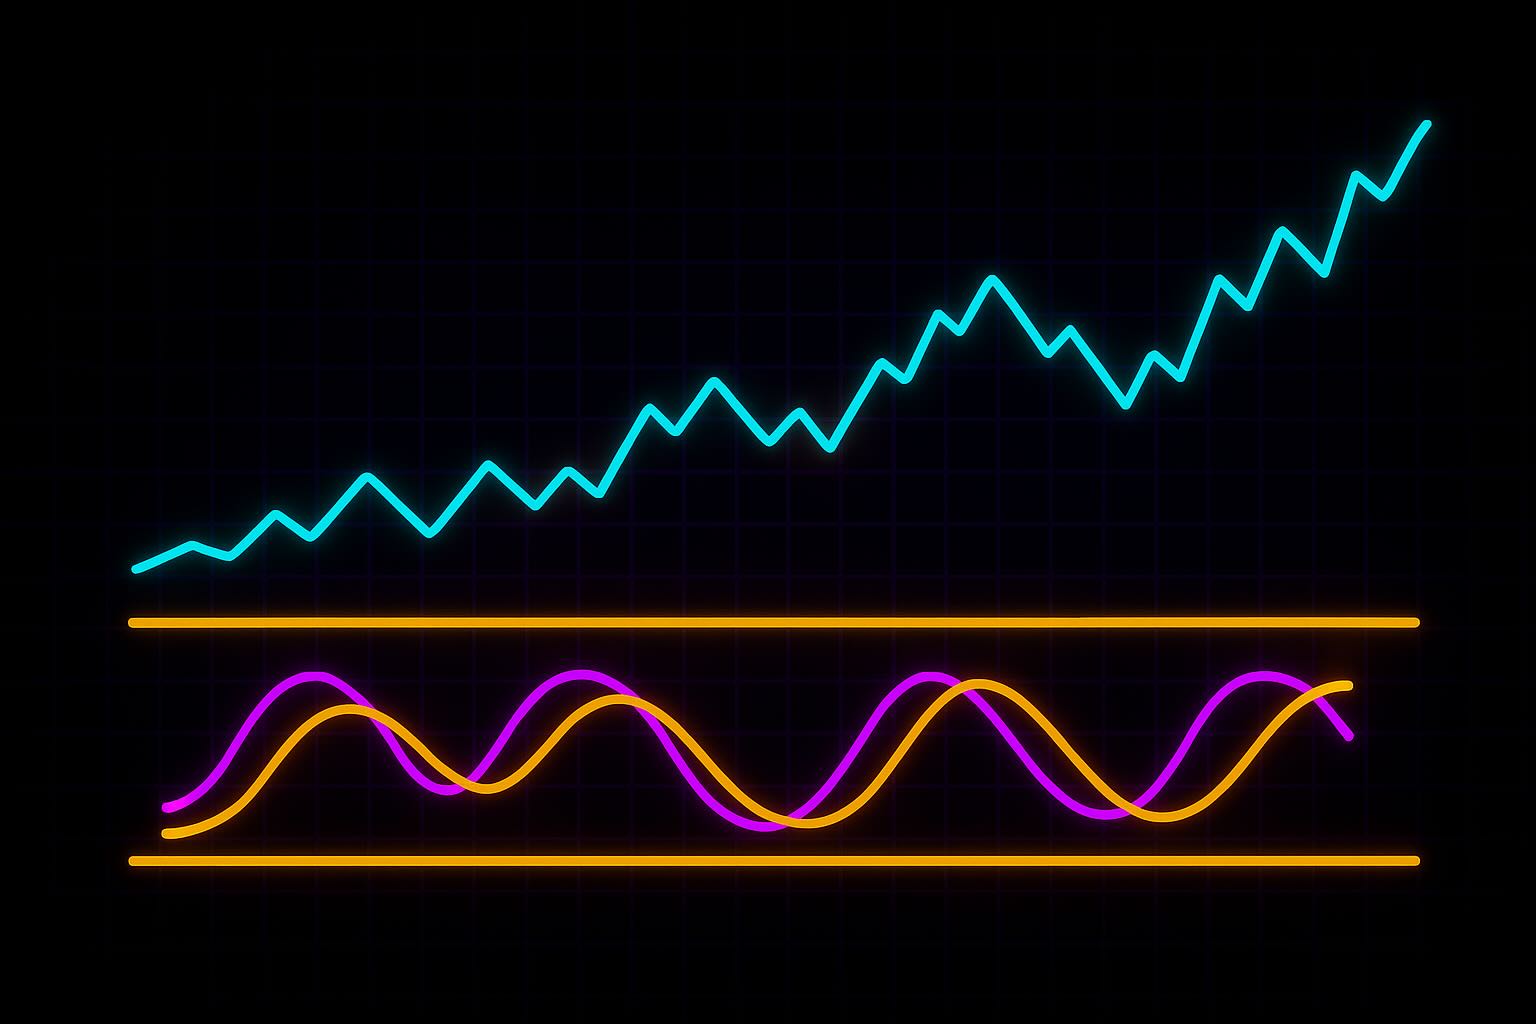
Moving Averages Explained for Crypto
Track the market's direction with moving averages. Learn how SMAs and EMAs reveal trend strength, support zones, and momentum shifts in crypto.
Explore The How
Moving Averages Explained for Crypto
Trend Analysis & Momentum
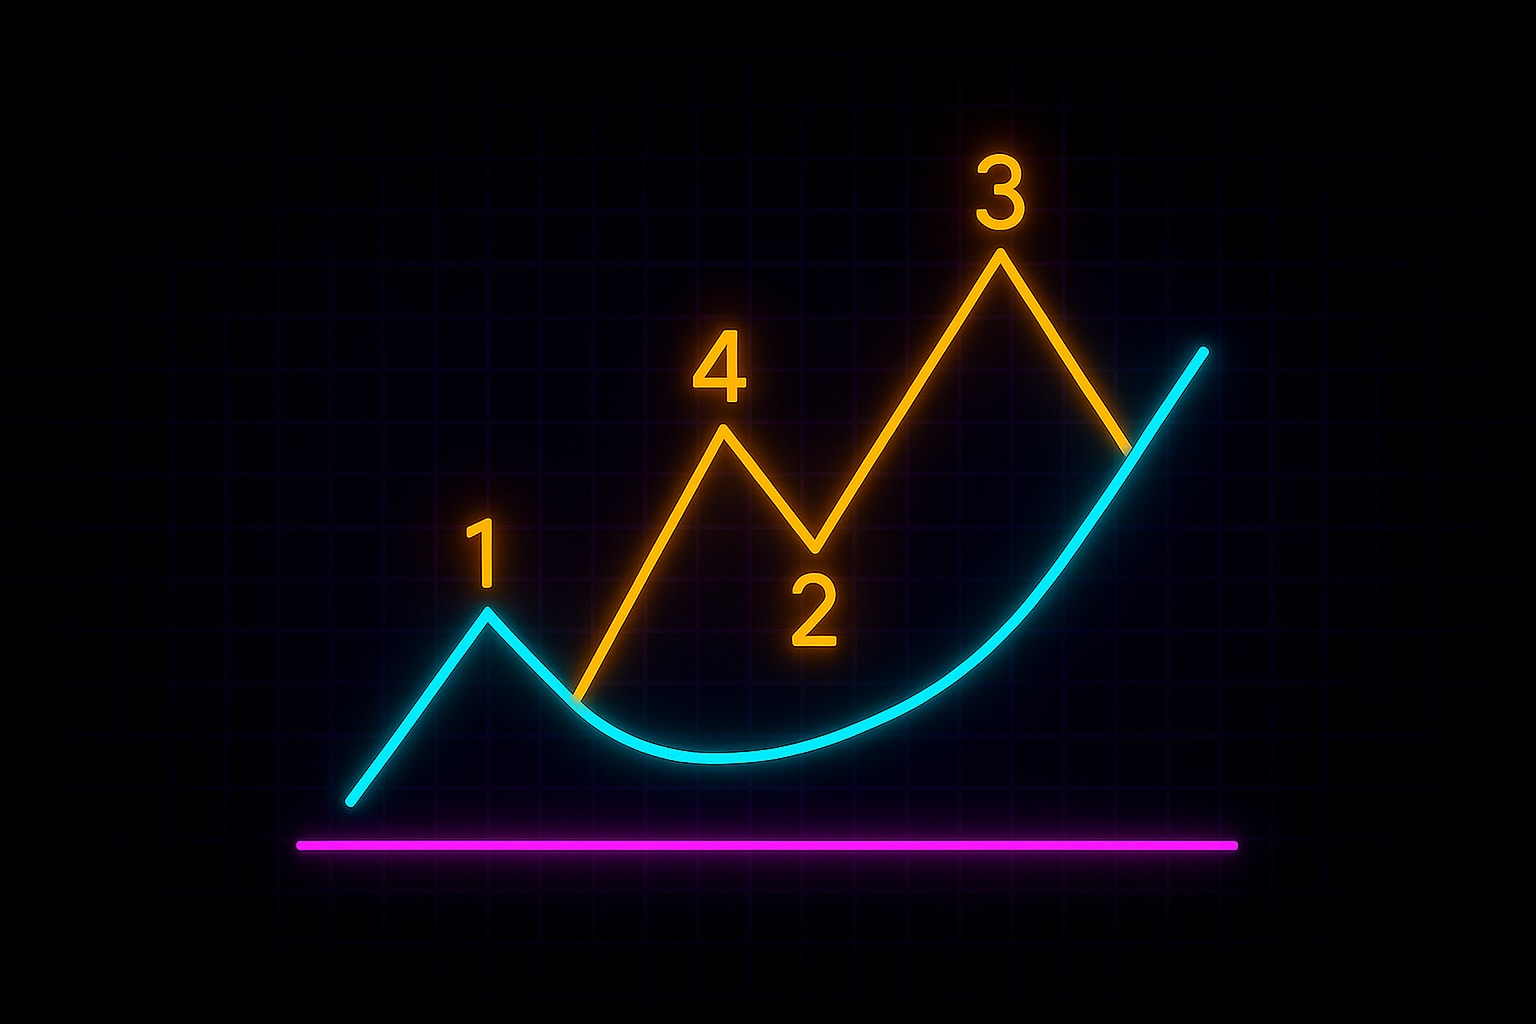
Elliott Wave Theory Explained
Markets move in waves, not straight lines. Learn how Elliott Wave Theory helps you identify cycles in crypto and prepare for what comes next.
Explore The How
Elliott Wave Theory Explained
Support, Resistance & Patterns

Trendlines Explained for Crypto
Draw the market's direction with clarity. Learn how to use trendlines in crypto to spot support, resistance, and momentum shifts before they happen.
Explore The How
Trendlines Explained for Crypto
Support, Resistance & Patterns
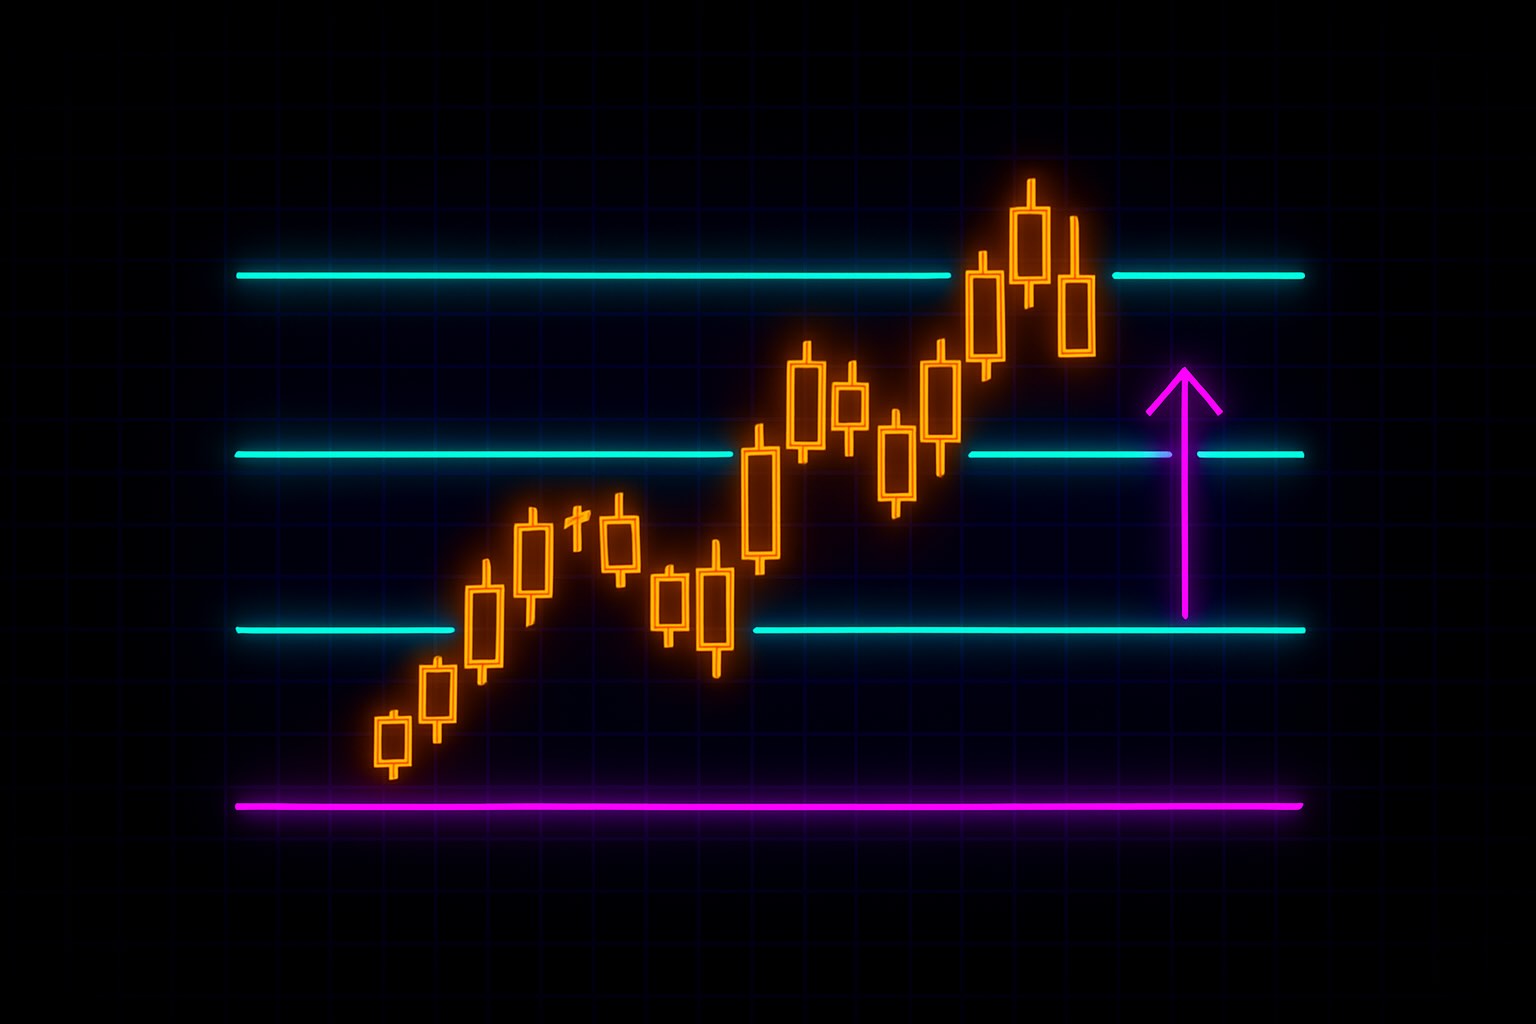
What Are Pivot Points in Trading
Use previous price action to find where crypto markets may pause, bounce, or reverse. Learn how pivot points guide entries and risk levels.
Explore The How
What Are Pivot Points in Trading
Support, Resistance & Patterns
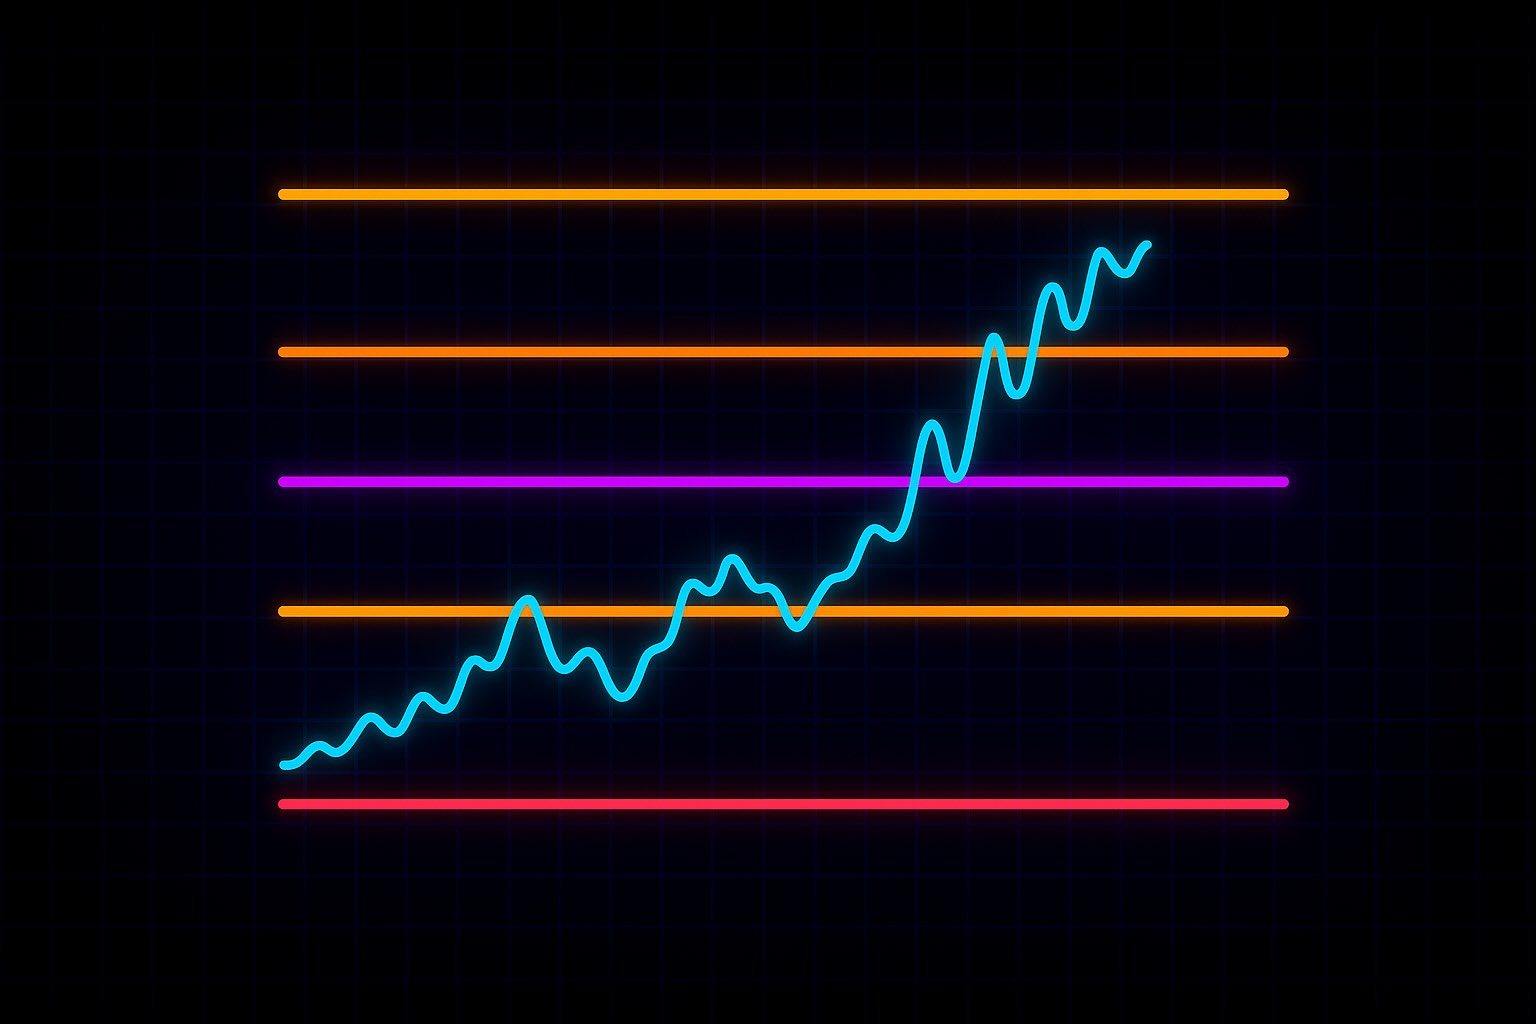
Fibonacci Retracement Explained
Spot likely pullback zones after strong crypto price moves. Learn how Fibonacci retracement levels add structure to your entries and exits.
Explore The How
Fibonacci Retracement Explained
Support, Resistance & Patterns

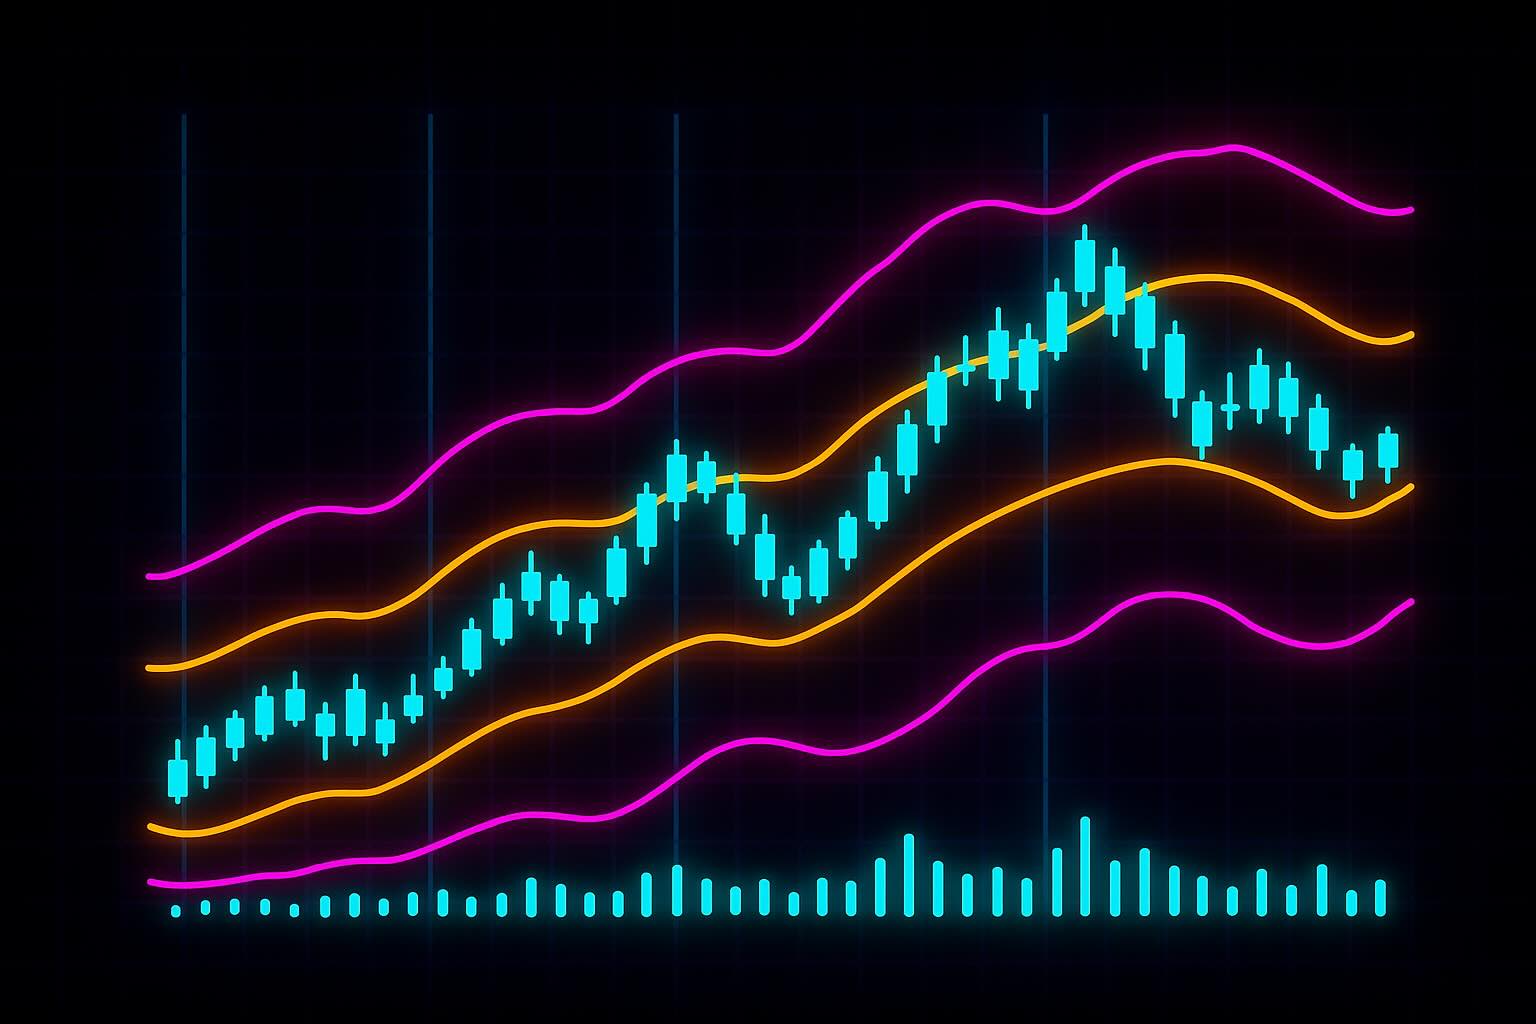
Ichimoku Cloud Explained for Crypto
See trend, momentum, and key levels in one view. Learn how the Ichimoku Cloud works in crypto and what it reveals about where price is heading.
Explore The How
Ichimoku Cloud Explained for Crypto
Trend Analysis & Momentum