


Verified Platforms
Quick Links
Where to Stay Secure
Thank you! Your submission has been received!
Oops! Something went wrong while submitting the form.

The upper band is not a sell signal.
The lower band is not a buy signal.
Bollinger Bands don't tell you what to trade — they tell you what kind of market you're in. That distinction, once it becomes automatic, changes how you read every chart.
This is a Kodex walkthrough with Ava. You'll work through Bollinger Bands from the ground up: what the three lines actually measure, why market condition classification comes before any signal, what the squeeze means and what it doesn't, why fighting a band walk is one of the most consistent ways to lose money, and how crypto's 24/7 structure requires settings adjustments the defaults don't make for you. By the end, you'll have a working framework for applying the indicator — and you'll know when to stop listening to it.
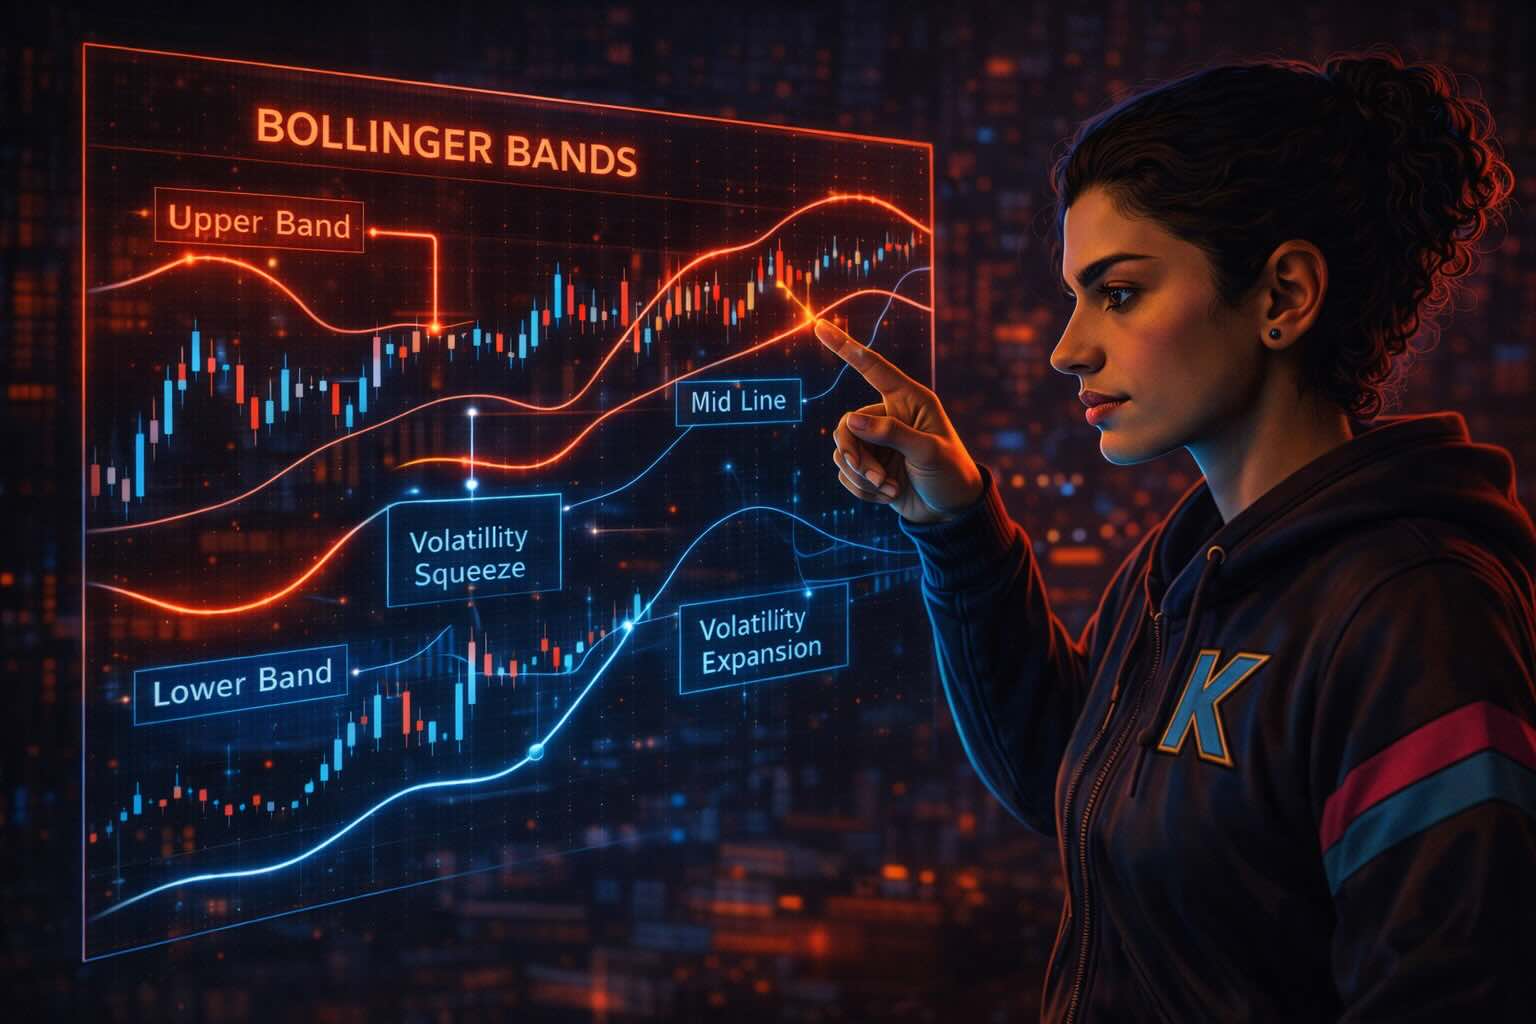
Ava doesn't start with a definition.
She pulls up a chart. No annotations, no strategy markers — just a clean candle structure with three lines wrapped around price. The lines breathe with the market. Wide when candles are large and erratic. Tight when price sits in a narrow range.
"What do you see?" she asks.
A volatility envelope, you say. The bands expand when the market is active and contract when it's quiet.
"Exactly." She doesn't elaborate. "You already know what this tool does."
Bollinger Bands are a volatility indicator, developed by John Bollinger in the early 1980s. The middle band is a simple moving average of closing prices — 20 periods by default. The upper and lower bands sit two standard deviations above and below that average. Standard deviation measures how far prices are dispersing from the mean: when the market moves with force, dispersion increases and the bands widen; when price consolidates, dispersion falls and the bands narrow.
The calculation:
Middle band: 20-period simple moving average of closing prices
Upper band: 20-period SMA + (2 × standard deviation of closing prices)
Lower band: 20-period SMA − (2 × standard deviation of closing prices)
Under normal statistical conditions, roughly 90% of price action falls within two standard deviations of the mean. When price reaches or crosses a band, it's entering territory that represents a statistical departure from recent behavior. That's worth attention — not because a reversal is inevitable, but because ordinary distribution has been exceeded.
"Statistically uncommon," Ava says, "is not the same as 'here's what to do.'"
The misreading starts exactly here. Traders see price touch the upper band and call it overbought. Price touches the lower band and call it oversold. The bands are describing something real — they're not prescribing a trade.
The middle band is the market's center of gravity for the measurement period. Price returns to it after extremes — not because of any mechanical force, but because the formula tracks mean reversion in a price distribution. In trending markets the middle band shifts directionally; in ranging markets it holds flatter. Whether it acts as meaningful support or resistance depends on context. That context is the subject of the next chapter.
The upper band marks the zone where price is statistically extended to the upside. "Extended" is precise and important. Not overbought. Not due for reversal. Extended — moving further from its recent average than is typical.
The lower band marks the equivalent extension to the downside.
"Stop reading these lines as commands," Ava says. "They describe where price is. They don't predict where it's going."
One technical point before the strategy: the original Bollinger Band settings were calibrated for equity markets trading five days a week. A 20-period daily chart in that context represents roughly four calendar weeks — a usable monthly baseline. Crypto trades 24 hours a day, seven days a week. A 20-period daily crypto chart covers less than three calendar weeks. If the monthly baseline matters to your analysis — and for daily timeframe traders, it does — adjust the period to 28–30. This doesn't change how the indicator works. It aligns the middle band with the timeframe it was designed to represent.
For high-volatility altcoins that routinely move 10–15% in a day, the default standard deviation multiplier of 2 generates frequent "extreme" readings that aren't particularly extreme for that asset. A multiplier of 2.5 expands the bands further and reduces noise. For Bitcoin and the major caps, 2 is appropriate.
The full calculation and parameter logic is in the Bollinger Bands explainer if you want to work through it.
Ava switches to a different chart — same indicator, different asset, different recent history.
"Before you read any signal from the bands, answer one question: is this market trending, or is it ranging?"
This is the step the indicator requires and most explanations bury.
In a ranging market — price bouncing between support and resistance with no clear directional momentum — the bands stay relatively flat and parallel. The upper and lower bands act as approximate boundaries. A touch of the upper band suggests price has reached the upper edge of the range; mean reversion toward the middle is the expected next move. A touch of the lower band carries the same implication in reverse. In this context, band touches carry real information.
In a trending market — price moving with sustained directional momentum, making higher highs and higher lows — the bands tilt and widen. Price walks along the upper band without reversing. The upper band touch is not an overbought signal in this context. It's confirmation that momentum is continuing. Shorting a band touch in a trending market is not a contrarian read — it's misclassification.
"Check the band direction first," Ava says. "If both bands are roughly flat and price has been oscillating between them across the last 10–15 candles, you're in a range. If the upper band has been rising consistently and price keeps touching it without pulling back to the midline, you're in a trend."
This is not nuance to apply after you've identified a signal. It's the prerequisite that determines whether the signal is valid at all.
How to classify visually: look at band history, not just the current bar. Ranging conditions show flat, parallel bands with price oscillating through the middle line regularly. Trending conditions show one band rising while the other holds or rises more slowly — the bands are asymmetrically widening. Price during a trend clusters in the upper or lower half of the band channel without completing a full oscillation to the opposite side.
Zoom out before zooming in. A 50–100 candle view of band behavior will answer the classification question faster than staring at the last five bars.
When volatility drops to unusually low levels for a given asset, the bands narrow. The upper and lower bands converge toward the middle line. The distance between them reaches a multi-week or multi-month minimum. This compression is the Bollinger Band squeeze.
The squeeze tells you the market is coiling. Periods of very low volatility don't persist indefinitely — a period of expansion is coming.
What the squeeze does not tell you is which direction the expansion will go.
This is the key misread: the squeeze looks like a compressed spring, and springs release — so it gets treated as a buy signal. The problem is that volatility contractions resolve in both directions. The squeeze signals that a significant move is approaching. It does not signal whether that move is up or down.
The correct entry logic: wait for confirmation. Specifically — a candle closing clearly outside the compressed band range, with volume increasing. The bands beginning to expand directionally. Ideally, a second candle confirming the break. Without these, entering in anticipation isn't trading a confirmed breakout. It's a directional bet placed before the information exists.
In crypto, this matters more than in traditional markets. Squeezes resolve faster — sometimes in 24–48 hours in Bitcoin, faster still in high-volatility altcoins. The speed of resolution means position sizing before the break needs to account for a fast, adverse move. A predefined stop loss outside the compression, on the side opposite your trade, keeps the risk bounded regardless of which direction the squeeze resolves.
Ava annotates the chart: bands narrowing into a tight formation over six sessions, price making smaller and smaller candles, then a high-volume candle closing well above the upper band with the bands beginning to fan out. "The bands gave you the warning. Volume gave you the direction. You needed both."
The squeeze is a preparation signal, not an entry signal. The entry comes after the break.
This is where the indicator costs the most money. Not from miscalculating the formula — from applying a working pattern in the wrong context.
Bitcoin has been grinding upward for four days. Each pullback is shallow. Price touches the upper band, pulls back a few candles, touches it again. You're watching the repeated upper band touches and your read is: "Overbought. The reversal is overdue."
Don't short it.
Price walking the upper band in a trending market is a sign of sustained momentum, not exhaustion. The upper band keeps moving up because price keeps exceeding the statistical average to the upside. That's what a trend does — it doesn't stop at the average; it keeps exceeding it. "Overbought" in this context just means the trend is strong. The band is not the ceiling. It's widening because the ceiling keeps moving.
The trap has a specific anatomy. In ranging markets, upper band touches reliably precede mean reversion. The pattern is real and works in its correct context. Then the market transitions into a trend, and the same mechanical setup appears — band touch, price extended, familiar signal — but the underlying condition has changed. The mean reversion that followed in the range doesn't follow in the trend. Each entry feels like bad timing rather than misclassification. The losses accumulate without a single obvious mistake to point to.
Ava pulls up a sustained uptrend on a mid-cap chart. "Count the upper band touches before a meaningful reversal." There are fourteen consecutive instances where price touches or exceeds the upper band before any sustained pullback materializes. "Every one of those was a potential short entry. None of them worked."
The behavioral signature — entering short at band touches regardless of market condition — is the kind of systematic misapplication that accumulates without announcing itself as a pattern. Market Tools includes Pattern Intelligence, which can surface this across your trade history: whether you're consistently fading band touches in trending conditions, what your win rate looks like on those specific entries, and how those compare to entries that follow trend direction.
What to watch for when a trend does begin to weaken: the middle band stops rising sharply. Price fails to reach the upper band on a rally — it stalls at the midline or falls away before making contact. The bands begin to flatten. Volume on up-moves decreases relative to down-moves. These signals are gradual; they don't coincide with a single band touch. The band walk ends before the reversal is obvious.
The question before any band touch signal: which environment are you in? The answer changes whether the touch is a signal or a trap.
Ava opens the indicator settings. Period: 20. Standard deviation: 2. "These defaults come from a specific historical context. Know the context before you decide if the defaults fit."
Period length. The 20-period default was calibrated for stock markets. Five trading days per week, four weeks per month — 20 days covers roughly a month. Crypto's continuous 24/7 trading schedule means 20 daily periods covers less than three calendar weeks. For a true monthly baseline on daily charts, use 28–30 periods. On shorter timeframes — 4-hour or 1-hour — the 20-period default is less distorted and generally appropriate. On weekly charts, 20 weeks is 20 weeks regardless of market schedule, so the default holds.
Standard deviation multiplier. The standard of 2 is appropriate for assets that follow a relatively normal return distribution — major indices, large caps. Bitcoin and Ethereum in normal conditions: 2 works. For smaller altcoins with high average daily volatility — regularly moving 5–10% in a session — a multiplier of 2.5 or 3 prevents ordinary volatility from triggering constant false "extreme" readings. The wider the bands, the less frequently price exits them, and the more meaningful it is when it does.
No single configuration fits every asset and every timeframe. This is the calibration work that simulation is for — test your settings against a specific asset's volatility profile before committing them to a live chart.
Bollinger Bands are a standalone volatility indicator. They are not standalone entry signals. The band touch describes where price is relative to its distribution. The trade needs another input to determine what's likely to happen next.
Three approaches, each answering a different question:
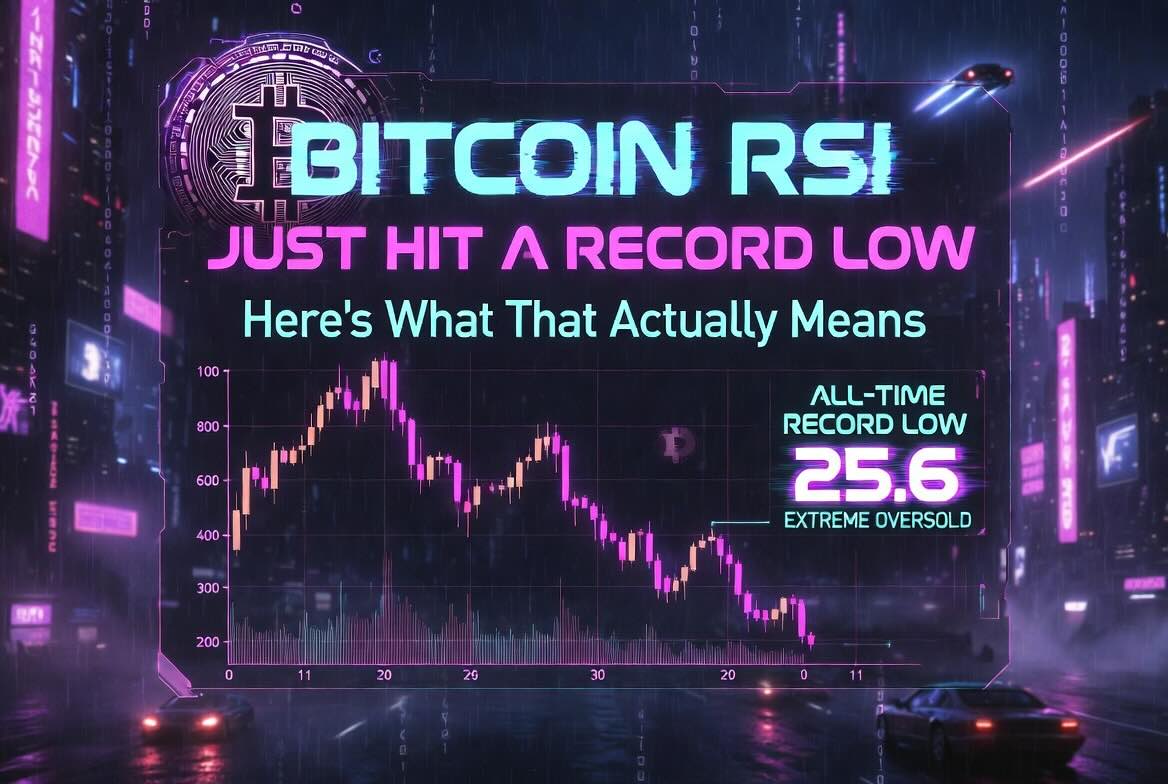
RSI for overbought/oversold confirmation. A lower band touch while RSI is at or below 30 strengthens the mean reversion case — two independent systems pointing at the same condition. A lower band touch while RSI is at 50 is less definitive; price is statistically extended, but momentum isn't confirming exhaustion. The same logic applies to upper band touches with RSI above 70. One reading without the other is a weaker signal.
Volume for breakout confirmation. Squeeze breakouts require volume. A break outside the compressed bands on low volume is more likely a false move than a genuine directional shift — the market has broken the statistical range without the participation needed to sustain the direction. A breakout on volume that clearly exceeds the recent average — particularly closing well outside the bands — carries structural weight. No volume: wait. Volume spike: evaluate the break.
MACD for trend direction. When reading a band walk, you need to know whether directional momentum is building or fading. MACD is the most-used analysis tool on Kodex, covering 53 % analyses run on the platform — the combination of MACD and Bollinger Bands for trend confirmation is already established in how traders here work. A strong MACD signal aligned with a band walk confirms continuation; divergence between MACD and price action during a band walk can be an early signal that the trend is losing momentum before the reversal appears in the bands.
None of these combinations replace the market condition read from Chapter 3. They add weight to a signal that has already been correctly contextualized — they don't replace the first step.
"Reading this walkthrough is not the same as knowing how to use it," Ava says. "The pattern that trips you up won't be the one you're aware of. It'll be the one you think you have under control."
The practice structure:
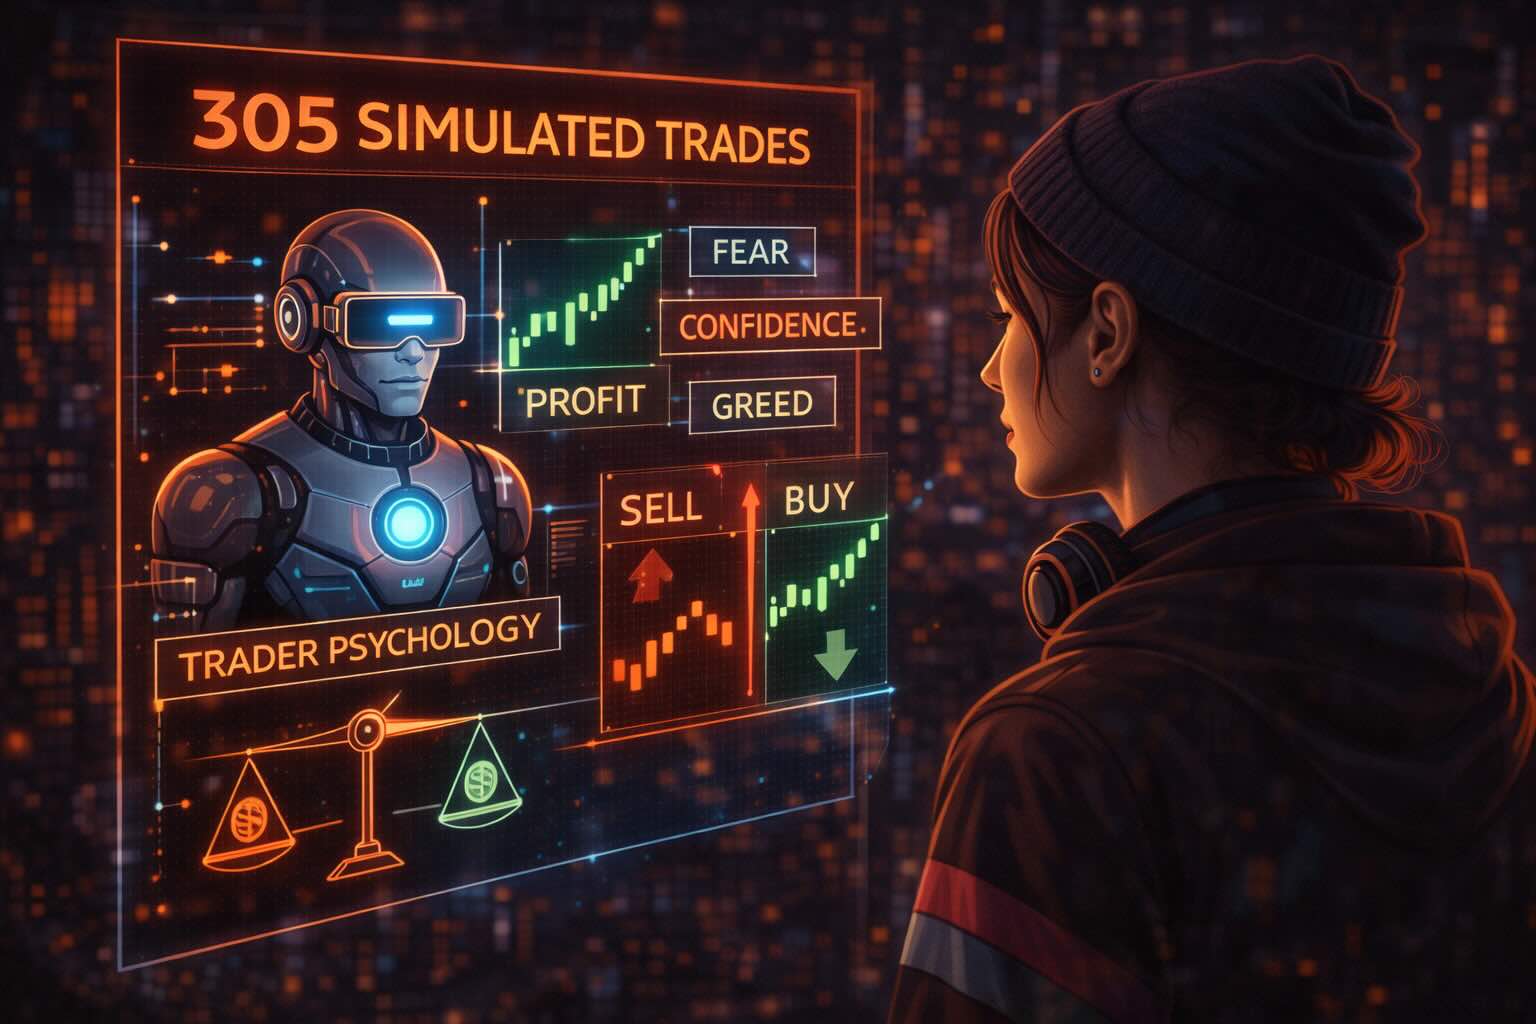
The Market Simulator gives you $5,000 in paper capital against live market data. It's the clean environment for calibration: test a defined Bollinger Band strategy across different market conditions, different assets, and different timeframes without real capital at risk. The questions to answer in simulation aren't theoretical — they're operational: how often do your squeeze entries confirm before the bands expand? What's your win rate on band touch entries in ranging versus trending markets?
Run 20–30 simulated trades with a clearly defined strategy before moving to real capital. Not to prove the strategy works in general — to prove you can execute it consistently and identify the conditions that make it valid.
Ava closes the chart. "The bands don't make decisions. They give you the information the decision requires."
The information starts with one question: trending, or ranging?
Bollinger Bands give you something specific: a real-time read on volatility expansion and contraction, set against recent price behavior. Used correctly — after classifying market condition, with confirmation from a second signal — they provide a clear framework for knowing when to pay attention and when to wait.
The costly mistakes with this indicator aren't mathematical. They're contextual: applying mean reversion logic in a trending market, entering a squeeze without directional confirmation, fighting a band walk because the price looks extended. These aren't random errors. They're predictable patterns — and patterns can be tracked, corrected, and eventually removed from your trading.
Start with the question. Build from there.