


Verified Platforms
Quick Links
Where to Stay Secure
Thank you! Your submission has been received!
Oops! Something went wrong while submitting the form.

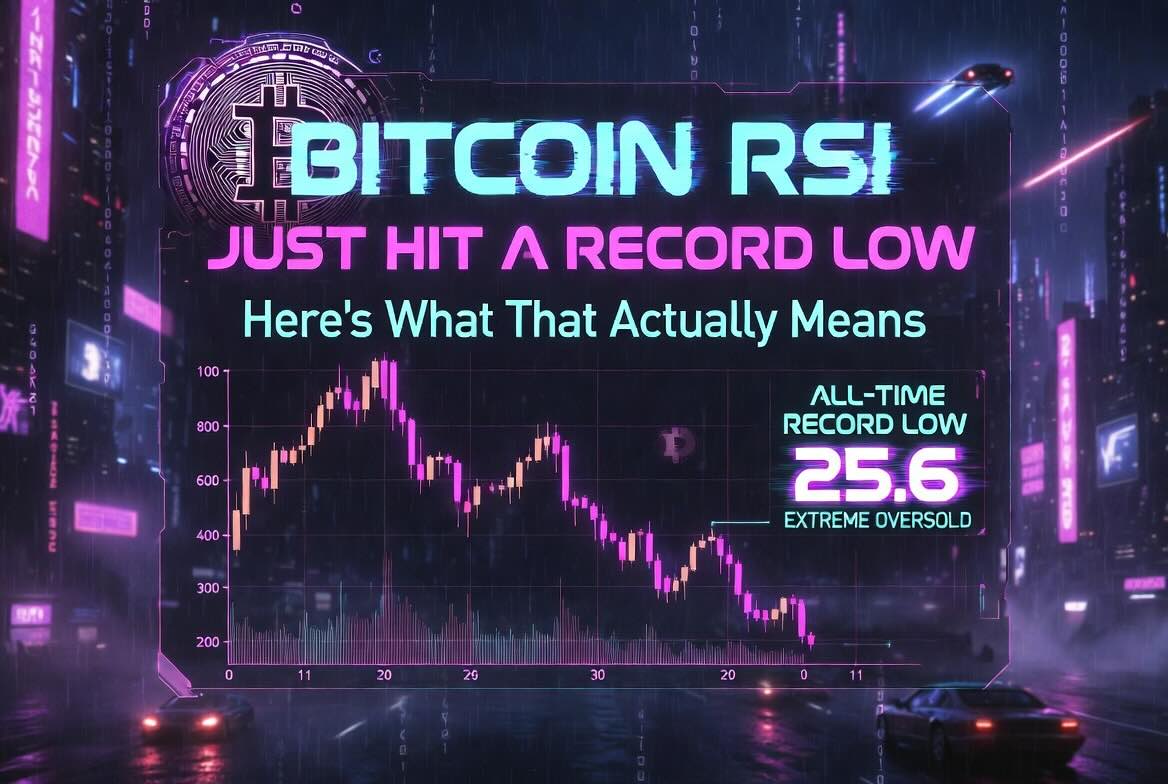
Bitcoin’s weekly RSI has fallen into territory it almost never visits.
That part is real.
The part getting distorted is what that actually means.
Recent market coverage described Bitcoin’s long-horizon RSI as having dropped below 30 for only the third time in its history, with readings around 25.6 cited across several reports. That makes the signal rare. It does not make the signal self-explanatory.
This is a Kodex walkthrough on RSI in 2026: what it measures, how to read it properly across timeframes, what a reading at this level actually signals, and where that signal ends.
The Relative Strength Index is not a sentiment poll.
It does not measure fear, headlines, narrative tone, or macro anxiety. It measures one thing: the speed and magnitude of recent price movements relative to each other.
J. Welles Wilder designed it to answer a focused momentum question: is the current move still pushing with force, or is that force beginning to fade?
That is why RSI matters.
The indicator compares average gains and average losses over a chosen lookback period — most commonly 14 periods — and compresses that relationship into a number between 0 and 100.
Above 70, gains have significantly outpaced losses.
Below 30, losses have significantly outpaced gains.
That is all.
The important word is exhaustion.
A low RSI does not say price must bounce. It says selling pressure has become extreme relative to the recent structure. It is a statement about momentum compression, not timing.
At a weekly RSI level this low, the actual signal is narrower and more useful than the headline version:
Selling pressure has been sustained, abnormal, and historically rare. That does not tell you what the next candle is. It tells you the current move is deep enough that the market deserves to be watched for a change in character.
That is a very different sentence.
The RSI scale has three useful regions.
Two get most of the attention. One is often more useful than both.
The Overbought Zone (Above 70)
An RSI above 70 means the market has been posting gains quickly and consistently enough that upside momentum is stretched.
That is not the same as saying price must reverse.
In a strong bull trend, RSI can remain above 70 far longer than the word overbought implies. Exiting strength simply because the indicator crossed 70 is one of the cleaner ways to abandon trend continuation too early.
The more useful signal is not the crossing itself.
It is what happens when price makes a new high and RSI fails to do the same.
That divergence matters because it suggests the trend is extending on less internal force than before.
The Oversold Zone (Below 30)
The same logic works in reverse.
An RSI below 30 does not mean price stops falling. In a real downtrend, the indicator can stay oversold longer than is comfortable. That is why using it as a trigger tends to go badly.
The raw level is not the full signal.
The more useful read is whether the indicator begins to turn, whether it forms a base, and whether it starts to diverge from price on the next leg lower.
That is what matters now.
Ava marks the chart without any theatricality.
“RSI this low doesn’t tell you the bottom is in,” she says. “It tells you the market has reached a level of one-sided selling that very rarely sustains forever. The actual question is whether the next move shows the same force — or less.”
That is the real use of the signal.
The Midline (50)
The most underused region is the midline at 50.
RSI around 50 means gains and losses are roughly balanced. In practice, sustained holds above 50 often support the idea that momentum is structurally improving, while sustained holds below 50 support the idea that the broader trend remains under pressure.
In Bitcoin’s current case, the weekly reading is so far below that neutral region that 50 is not a trading signal yet. It is a reminder of how much momentum damage would need to be repaired before the structure looks broadly healthy again.
This is the single most important context that fast coverage tends to flatten:
The reading being discussed is on the weekly chart.
That matters because RSI behaves very differently across timeframes.
A 4-hour RSI can go from oversold to neutral to overbought inside a short volatility burst.
A daily RSI can reset quickly in a rebound.
A weekly RSI is slower, heavier, and structurally more important because it reflects sustained price behavior over roughly three and a half months.
That is why a weekly drop below 30 matters.
It does not describe a brief panic. It describes a market that has been under meaningful pressure for an extended period.
Coverage in February 2026 repeatedly framed Bitcoin’s RSI drop below 30 as only the third time that had happened on a long-horizon reading, with comparisons pointing back to 2015 and late 2018. That historical context is useful — but only if it is read properly.
The earlier instances did not produce a clean single-candle reversal that made everything obvious. They were followed by time, hesitation, consolidation, and the sort of patience that rare readings tend to erase.
That gap matters.
The indicator may be accurate about exhaustion while remaining silent about timing.
Ava studies the weekly view.
“This is where the number becomes a trap,” she says. “Rare data creates urgency. Weekly signals usually do the opposite. They change the probability structure before they change the chart.”
That is the better way to hold it.
The most useful thing to watch from here is not the headline number itself.
It is RSI divergence.
That happens when price makes a new low but RSI makes a higher low. In plain terms, the market still pushed price down, but it needed less momentum to do it. The selling pressure behind the second move was weaker than the first.
That is the structural difference that matters.
The low reading tells you where the market is.
The divergence tells you whether the internal engine of the move is starting to weaken.
That is why divergence is more actionable than the raw 25.6 figure by itself.
If Bitcoin retests lower levels and the weekly RSI holds up better than price does, the read begins shifting from “extreme selling” toward “possible exhaustion resolving.” If price falls again and RSI continues compressing with no sign of base formation, then the market is still saying the pressure has not finished.
That is a cleaner framework than trying to squeeze certainty out of a rare number.
Extreme indicator readings create a specific kind of cognitive trap.
They feel like evidence.
And to be fair, they are evidence.
But they are not complete evidence.
That distinction is where bad positioning begins.
The logic chain sounds tight: the reading is rare, prior instances preceded major rallies, therefore the market is setting up the same way again.
The problem is what that chain leaves out.
The 2026 environment is not a copy of 2015 or 2018. U.S. spot Bitcoin ETFs were widely reported to have seen roughly $4.5 billion in outflows across the opening stretch of 2026, while separate reports described whale wallets absorbing roughly 270,000 BTC over the prior month. Those are real structural forces acting on the same market at the same time.
That is the real lesson.
RSI reflects the momentum structure of price. It does not explain the whole architecture pressing on that price.
The signal is probabilistic, not prescriptive.
A rare weekly RSI reading shifts the base rate of the analysis. It tells you this level of pressure has historically been associated with late-stage stress, not that an entry, a bottom call, or immunity from further downside has been handed over.
Ava says it flatly.
“Rare doesn’t mean ready,” she says. “It means pay attention.”
That line is worth keeping.
Because what usually follows a rare reading is not instant clarity. It is premature certainty, oversized conviction, and frustration directed at the indicator for failing to do something it never claimed to do.
RSI is better used as a confirmation tool than as a trigger.
That single distinction avoids a surprising amount of damage.
The framework is simple.
Layer 1 — Level
Is RSI in an extreme zone?
If yes, the task is not to increase size. It is to increase attention.
That is the point where the market deserves closer reading, not automatic action.
Layer 2 — Direction
Is RSI still falling, or has it started to turn?
A floor at 25.6 is only useful if the indicator begins recovering from it. A reading that continues to compress without forming a base is not a buy signal. It is evidence that selling pressure has not yet found its limit.
Layer 3 — Divergence
When price makes its next meaningful low, compare that move with RSI.
If price makes a lower low while RSI makes a higher low, that is the first real sign that the market may be losing downside momentum internally.
That is where the probability begins to shift.
None of this requires prediction.
It requires reading the data as it develops and waiting for confirmation instead of acting on anticipation.
Volume helps here too. If volume declines on each successive price drop while RSI begins forming divergence, the signal strengthens. If volume expands aggressively on new lows, then selling pressure is still broad enough that RSI alone should not be trusted.
Understanding RSI in an article is one thing.
Reading it correctly while the chart is moving and the position is under stress is something else.
Kodex’s live TA analysis includes RSI alongside 13 other indicators, each running through a structured four-step loop: analyze the current reading, understand what that reading measures, simulate a position based on it, and compare the outcome against alternative reads. That makes the indicator useful in combination rather than in isolation, which is how it actually functions in real analysis.
The crypto trading simulator is where RSI stops being theoretical. Live market prices, zero real risk, starting with paper capital. The value is not only in seeing the chart. The value is in making decisions from the chart and then watching how those decisions hold up against actual market movement.
Over time, that builds something much more useful than confidence.
It builds a track record.
Chart Mastery fills in the full technical picture: how to read RSI alongside price structure, volume confirmation, and momentum without falling into the single-indicator trap.
Pattern Intelligence surfaces the behavioral layer underneath those technical decisions. Over time, it tracks how often entries happen on RSI alone, how extreme-reading setups perform relative to the broader record, and whether position sizing expands precisely when a rare signal creates the illusion of certainty.
If the deeper challenge is operating clearly while the market is saturated with fear, The Survival Framework goes further into that mental layer.
Bitcoin’s weekly RSI at this level is real data about a real condition: selling momentum has compressed to an extreme reached only a handful of times in Bitcoin’s history. Prior instances eventually resolved upward. That pattern is worth knowing.
It does not make the next move predictable.
It does not give the entry.
It does not tell you when.
What it does is shift the probability structure — and tell you what to watch next.
RSI divergence on the next meaningful price test.
Volume behavior on successive lows.
The indicator forming a base and beginning to recover from extreme levels.
The work is learning to read those confirmations accurately enough that when they print, they are recognized for what they are.
Not because the bottom was called.
Because the structure was understood.
Bring it live on Kodex’s free RSI analysis and read the current market structure — not the headline number, the actual data.