


Verified Platforms
Quick Links
Where to Stay Secure
Thank you! Your submission has been received!
Oops! Something went wrong while submitting the form.

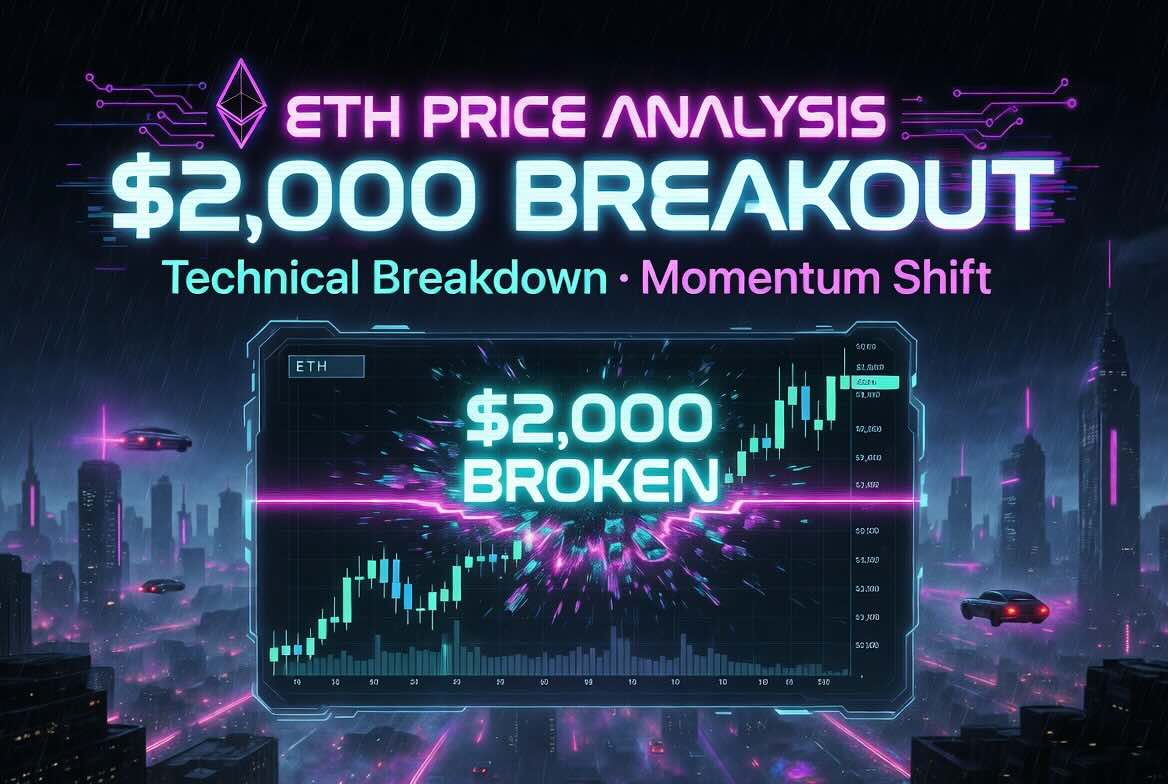
Ethereum pushed back above $2,000 after a sharp relief move. The question is not whether the bounce happened. It did. The question is what the chart is actually saying now — and what still has to confirm before this becomes anything more than a strong move inside a damaged structure.
This is a Kodex walkthrough with Ava.
You are looking for three things: the RSI recovery signal, the resistance levels that decide whether this bounce becomes structure or just release, and the strange fact that sentiment has remained deeply fearful even while price pushed higher. That combination matters more than the green candle does.
Ava does not open with celebration.
“Price went up,” she says, pulling up the chart. “Everyone can see that. The useful question is whether the move has structure under it — or whether this is pressure releasing before the market runs into the same ceiling again.”
You look at the screen.
Ethereum has reclaimed the psychological $2,000 area. The bounce is sharp enough to trigger urgency, which is exactly why it needs to be slowed down and read properly.
“So what does it say?” you ask.
“It says the market is trying to recover,” she says. “But recovery and confirmation are not the same thing.”
Before the bounce, Ethereum had spent weeks under heavy pressure.
That matters because RSI does not become useful when it flashes a magical reversal signal. It becomes useful when it shows that selling momentum has been stretched hard enough that the market is no longer behaving like a clean, healthy downtrend.
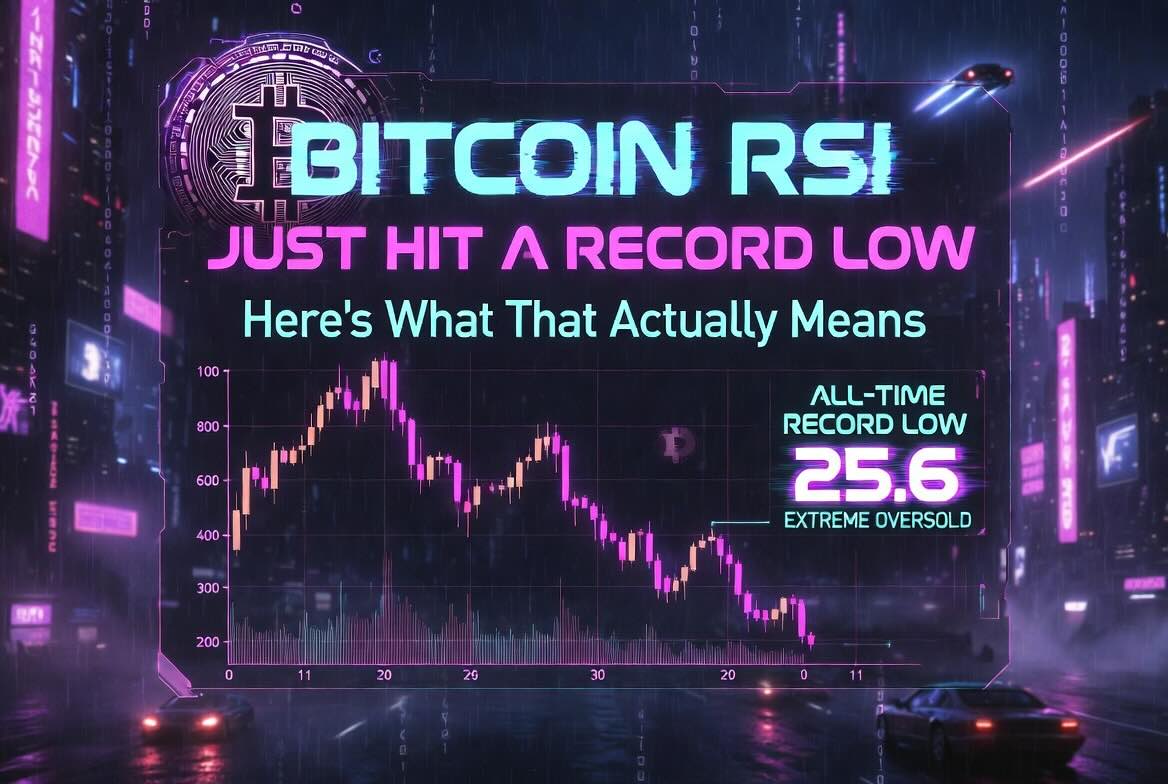
The Relative Strength Index measures the speed and magnitude of price changes on a 0–100 scale. Readings below 30 are traditionally considered oversold. In ETH’s case, the important point was not just that RSI had fallen hard. It was that momentum had become compressed enough to signal exhaustion risk rather than fresh downside conviction.
Ava taps the chart.
“RSI at extreme levels doesn’t guarantee a reversal,” she says. “It tells you the market has become one-sided. At some point, the sellers who drove it down stop finding the same fuel. That’s when the chart starts to change character.”
That is the first thing this move may represent: release from extreme pressure, not yet proof of a trend reversal.
The more useful read now is not “RSI bounced, therefore buy.” It is whether RSI can hold improvement as price tests resistance. If ETH pulls back modestly while RSI forms a higher low, that begins to tell a more constructive story. If RSI rolls over quickly while price stalls into resistance, the move starts to look more like reflex than recovery.
That distinction matters because the RSI signal is helpful — but not sufficient.
The real confirmation still comes from the price levels.
A sharp move above $2,000 gets attention because round numbers always do.
But round numbers are not the real decision points. Structure usually lives slightly above or below the clean narrative line.
The first gate is the $2,090–$2,100 area.
That zone matters because it acted as a repeated ceiling during the recent structure. A brief move through it is not enough. A wick is not enough. What matters is whether ETH can actually close and hold above that area in a way that changes the chart from “bounce into resistance” to “resistance becoming support.”
Ava marks the zone cleanly.
“If $2,100 acts as resistance again,” Ava says, “then the bounce is real, but the structure still hasn’t changed. That puts the lower support zone back in play. Not a disaster scenario — just the chart continuing to behave like the chart.”
That is the right way to think about it.
A bounce can be real without being durable. A move can be strong without becoming a new trend. If ETH fails to secure this first zone, the old structure remains in control, and lower support levels come back into play.
The second gate sits higher, around $2,350.
That is the level that matters more for medium-term direction because it is where a deeper layer of trapped supply and prior positioning is likely to re-engage. A move into that area with strong participation tells a very different story from a move that reaches it on weakening momentum and stalls immediately.
That is why the chart should be read level to level, not candle to candle.
The first gate tells you whether the bounce is gaining structural credibility.
The second gate tells you whether the market is doing more than relieving stress.
The move did not happen in a vacuum.
The broader crypto market reacted to renewed political pressure around the Clarity Act, with President Trump publicly attacking banks for obstructing parts of his digital-asset agenda as disputes over stablecoin rewards continued to delay the bill. Reuters reported that the White House had already been trying to broker a compromise between banks and crypto firms, and then reported on March 5, 2026 that the legislation had hit another impasse. That is enough to explain why policy headlines were active around this move. It is not enough to replace the chart.
Ava is precise about that distinction.
“The macro news explains why the move happened today,” Ava says. “It doesn’t confirm what the move becomes. A catalyst can trigger the candle. It can’t clear resistance for you.”
That is the part traders keep trying to skip.
News can create the impulse.
Structure decides whether the impulse sticks.
If you do not separate those two things, every rally looks tradable and every rejection feels surprising. Neither should.
The stronger read is more boring and more useful: yes, the macro-policy backdrop helped trigger a broad risk move. No, that does not eliminate the need to watch whether Ethereum can actually convert the first breakout zone into support.
A catalyst creates urgency.
The chart decides whether urgency becomes trend.
One of the more useful parts of your original frame is the sentiment paradox.
Fear remained elevated even while price bounced.
That is worth keeping, but more carefully.
On March 4, your snapshot used a Fear & Greed Index reading of 10, which is consistent with widespread extreme-fear readings seen around that stretch. By March 5, at least some market trackers were already showing a rebound toward the low 20s, which tells you something important on its own: sentiment was deeply damaged going into the move, and the recovery in psychology was lagging behind price.
That lag is the signal.
When price moves faster than sentiment, the market is often doing one of two things: recovering before the crowd trusts it, or staging a relief move that still lacks sponsorship strong enough to rebuild conviction. Sentiment alone cannot tell you which one it is. That is why the resistance gates matter.
Ava leans back.
“If everybody had already flipped bullish, I’d trust the move less,” she says. “The interesting version is when price improves before confidence does. That means the market still has to prove itself — but it also means the usual late emotional buyers are not fully here yet.”
That is a healthier way to frame it.
Not: fear stayed low, therefore bullish.
Not: fear stayed low, therefore fake.
Just this: the move is happening before full emotional participation has returned. That makes the next structural test more important, not less.
There are a few background signals worth noting, but they need to be handled with care.
Reports around this stretch have pointed to very low ETH exchange reserves, around 16 million ETH, which supports the broader idea that more coins are being held off-exchange rather than left in easy selling inventory. That is a constructive supply-side backdrop, even if it does not force immediate upside.
At the same time, U.S. spot Ethereum ETFs reportedly saw a $10.75 million net outflow on March 3, which suggests institutional demand was not exactly screaming confirmation at the same moment the chart was trying to bounce.
That tension is useful.
The supply picture can look constructive while institutional flows remain hesitant. That is not a contradiction. It is the kind of mixed backdrop that often resolves at major technical levels rather than in the middle of the range.
I would be more careful than your original draft on the active-addresses stat and on any precise long historical claim like “every sustained extreme fear reading below 15 resolved with major upside in 3–6 months.” Those lines sound convincing, but they are harder to support cleanly and do not actually make the piece stronger.
The piece is better when it stays with what can be said confidently:
That is already enough.
Ava closes the noisy lower-timeframe view and opens the daily.
“You don’t need to predict the next candle,” Ava says. “You need to know what the chart would have to do to earn the bullish version.”
That is the right ending.
The RSI recovery is constructive.
The move through $2,000 matters.
The policy catalyst helps explain why the market moved.
The sentiment lag makes the setup more interesting.
And still, the market has not finished answering the question.
That answer lives at the gate.
If ETH can hold above the first resistance zone and build from it, the bounce starts earning the right to be read as structural improvement rather than mere release. If it fails there, then the previous damage has not been repaired. It has only paused.
The discipline here is not passivity. It is directed attention.
You are not waiting blindly.
You are watching the exact areas that decide the structure.
The crypto trading simulator is useful here for a very specific reason: it lets you shadow-trade this kind of inflection without forcing real capital into a market that is still proving itself. Resistance tests are easy to describe and much harder to sit through. Practice matters before money does.
One of the most common trader errors at moments like this is simple: buying the emotional candle, panicking at the first resistance touch, and exiting right before the structure either confirms or invalidates. The problem is not only bad analysis. The problem is impatience under uncertainty. Pattern Intelligence helps you see that behaviour clearly — where you chase, where you hesitate, where you exit early, and where the chart stops being the chart and starts becoming your own psychology. In a setup like this, that is part of the analysis too.
The move already happened.
Now the chart has to tell you whether it was the start of structure — or just a sharp exhale inside the same unresolved range.
That is where your attention belongs.
The Levels That Matter Right Now
$2,090–$2,100 | First resistance gate
Recent ceiling. Holding above it would materially improve the structure. Rejection there keeps the bounce vulnerable.
$1,820–$1,850 | Support floor
A deeper demand zone worth watching if the first gate fails and the market rotates lower again.
$2,350 | Major resistance
The next meaningful test if ETH builds above the first gate. This is where medium-term conviction would need to show itself more clearly.
Chart Mastery covers exactly this kind of level-to-level reading — how to identify where the market is compressing, where pressure is stored, and what changes when price returns to those zones.
The Crypto Risk Management at Kodex is structured around exactly this kind of multi-variable risk assessment — how macro and regulatory environments factor into position sizing and decision frameworks. Market Tools carries live data on the assets most directly affected by these shifts in structure and sentiment.
The crypto trading simulator is where you practice reading these setups before real capital is involved.
Watch the close.
Watch the volume.
Watch the gate.
Technical data as of March 4, 2026. ETH price: $2,175 (+9.4% 24h). Fear & Greed Index: 10/100 (Alternative.me). Funding rate data: CoinGlass. Resistance and support levels based on price action analysis. This is educational content, not financial advice.