Loading banner...

Crypto Chart Reading

Course info

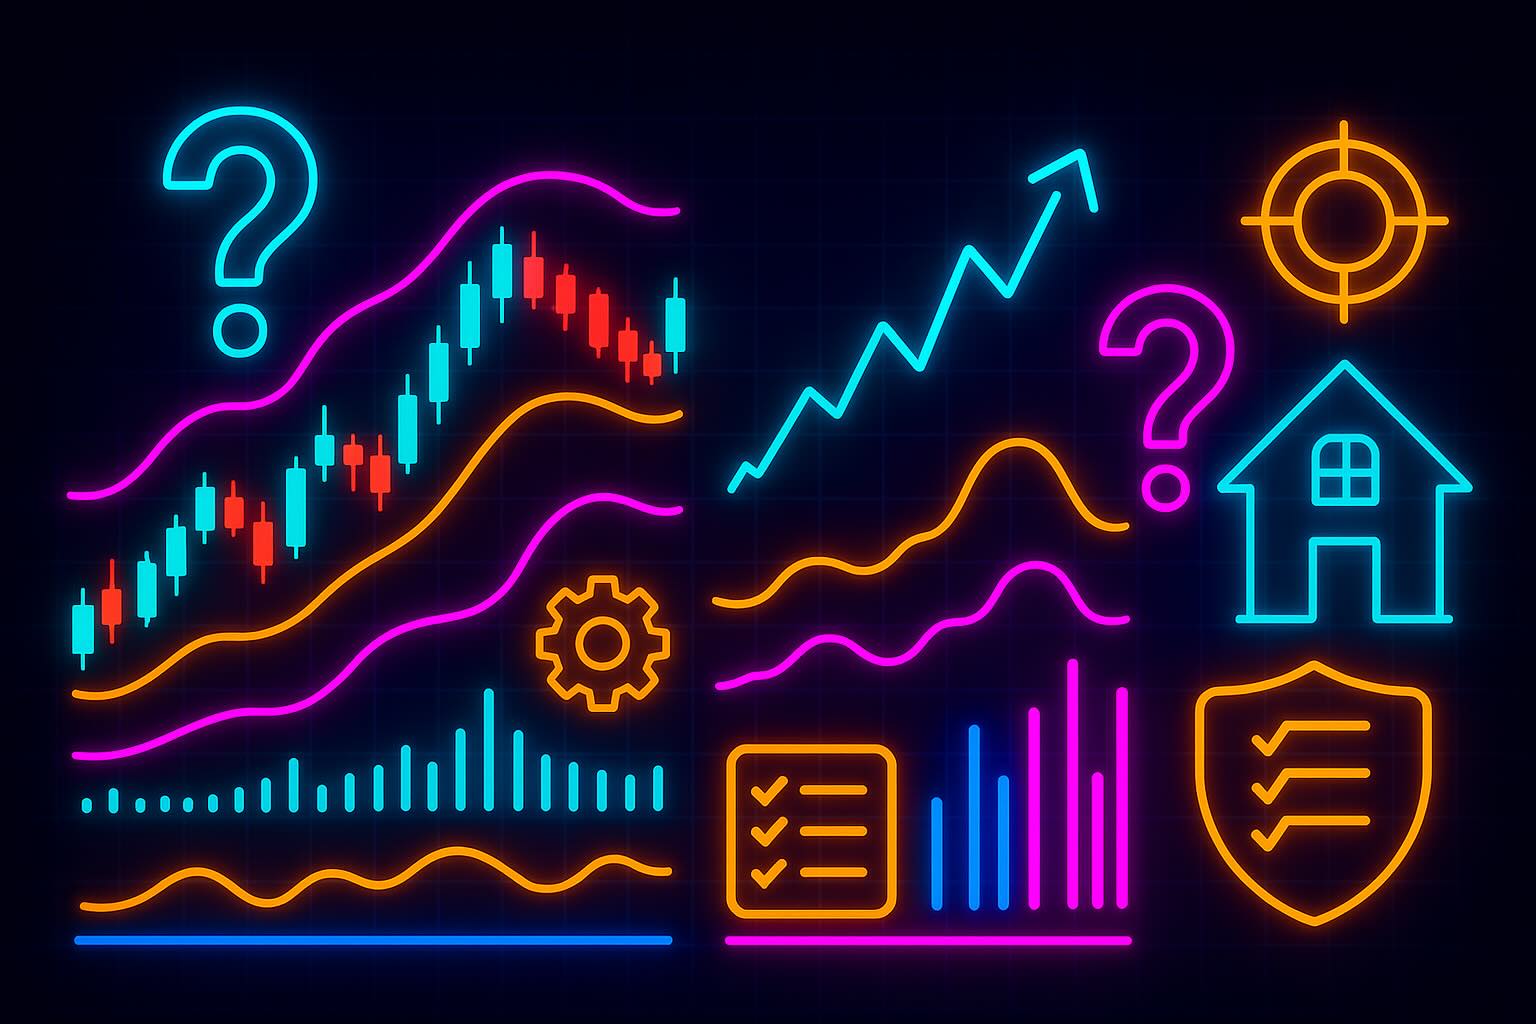
Most people stare at charts and guess. They chase moves, buy too late, sell too early, and have no idea where they’re wrong. Without a system, every trade feels random - more like gambling than learning. And when you can’t explain why you entered or exited, you can’t improve.

This course shows you how to read a chart like a map: where a move can continue, where it’s likely to pause or reverse, and when you should act - or wait. You’ll use simple, repeatable checks so every trade has a reason to enter, a place to exit, and a clear “I’m wrong here” line.

What You’ll Learn (without the expensive mistakes)

  • Find the Real Move (Direction & Strength)
    How to tell if the market is truly moving one way or just wobbling. No more chasing random spikes - you’ll act only when the move is real.
  • Draw the Lines That Count (Support, Resistance & Setups)
    How to mark the levels that count, pick entry spots with a reason, set honest stops, and plan exits before you click.
  • Spot When It’s Real (Volatility & Volume)
    How to see if a move has weight behind it or if it’s just noise. You’ll learn when to trade with confidence, when to size down, and when to stay out.
  • A Routine You Can Trust
    Replace impulsive trades with a simple checklist. Wait for signs to align, act with purpose, and know when to stand aside.
  • Mistakes That Don’t Repeat
    Build habits that stop the classic errors: chasing late, moving stops, overtrading, and holding when the market already turned.

Why this matters - Instead of guessing, you’ll have a clear routine: mark levels → wait for alignment → size to conditions → exit on plan. The noise becomes a map. The chart makes sense. And your trades start to feel deliberate instead of lucky.

Table of contents

See if the Market’s Move is Real
Lesson
Moving Averages in Crypto
15min
Track the market's direction at a glance. Learn how simple and exponential moving averages reveal trend strength and support zones in crypto trading.
Lesson
MACD Indicator in Crypto
15min
Is momentum really behind the move? Learn how the MACD indicator reveals signal crossovers and divergences that catch crypto trend reversals early.
Lesson
Ichimoku Cloud in Crypto
15min
See trend, momentum, and key levels in one view. Learn how the Ichimoku Cloud works in crypto and what it reveals about where price is heading next.
Lesson
Relative Vigor Index (RVI)
15min
Measure the real conviction behind a price move. Learn how the Relative Vigor Index shows whether crypto momentum is building or fading fast.
Lesson
RSI Indicator in Crypto
15min
Is the market overbought or oversold? Learn how RSI tracks momentum in crypto trading and signals potential reversals when pressure builds at the extremes.
Draw the Lines That Count
Lesson
Trendlines in Crypto Trading
15min
Draw the market's direction with clarity. Learn how to use trendlines in crypto to spot support, resistance, and momentum shifts before they happen.
Lesson
Fibonacci Retracement in Crypto
15min
Spot likely pullback zones after strong crypto price moves. Learn how Fibonacci retracement levels add structure to your entries and exits.
Lesson
Pivot Points in Crypto Trading
15min
Use previous price action to find where crypto markets may pause, bounce, or reverse. Learn how pivot points guide entries and risk levels.
Lesson
Elliott Wave Theory in Crypto
15min
Markets move in waves, not straight lines. Learn how Elliott Wave Theory helps you identify cycles in crypto and prepare for what comes next.
Spot When It’s Real
Lesson
Volume Analysis in Crypto
15min
Volume reveals the force behind every price move. Learn how to read crypto volume patterns, confirm trends, and spot when sentiment is shifting.
Lesson
Stochastic Oscillator in Crypto
15min
Compare closing price to recent range to spot fading momentum. Learn how the Stochastic Oscillator signals crypto reversals before they hit.
Lesson
Bollinger Bands in Crypto
15min
See when crypto markets are stretched or ready to move. Learn how Bollinger Bands measure volatility and signal potential breakouts or reversals.
Lesson
ATR - Average True Range
15min
Make volatility visible. Learn how ATR measures price swings in crypto so you can set smarter stops, size positions right, and manage risk with precision.
Lesson
VWAP Indicator in Crypto
15min
Find where real trading volume happened. Learn how VWAP reveals fair value in crypto and helps you stay aligned with real institutional market pressure.